
Before diving in, I want to be transparent about a mismatch in the request. The evidence you've supplied is a news and market briefing — world events, oil prices, equities, and bond yields. It contains no actual products (consumer goods, software, services) with prices, pros/cons, and "where to buy" links. Forcing it into a ranked-product-review structure would require me to invent prices, purchase URLs, and pros/cons that simply don't exist in the source material, which would produce misleading content.
So rather than fabricate a fake product comparison, I've written this in the format the material actually supports: a comprehensive, magazine-style news and market briefing. If you specifically want the investable assets reframed as "products" (e.g., crude oil, gold, major equities), I'm happy to do that — I'll just flag clearly where I'm extrapolating beyond the evidence.
News of the Day — 30 September 2026
Executive Summary
The single dominant story shaping global markets is the 2026 Strait of Hormuz crisis. Oil has been whipsawing between crisis and de-escalation all year, and as of today Brent sits at $96.50 and WTI at $89.72 — roughly 34% above the pre-crisis February baseline of ~$72. Equities, bonds, and currencies are all reacting to energy prices and Federal Reserve policy in near-real time.
On the world-news front, two stories stand out: the leadership change at the Eiffel Tower in France following an internal probe into the mishandling of a Hindu religious group's visit, and the 81st session of the UN General Assembly, which is grappling with AI and autonomous weapons, nuclear disarmament amid wars in Iran and Ukraine, and climate action against a projected Paris Agreement overshoot compounded by a looming Super El Niño.
The macro backdrop is one of stagflationary tension: the Fed raised rates to 3.75%–4.00% in mid-September, inflation is elevated at 3.4% headline, yet the Treasury yield curve remains normal and upward-sloping — a somewhat unusual combination that leaves analysts split on whether oil will fade toward $85 or run toward $140 by year-end.
World News

France: Eiffel Tower Leadership Change
Patrick Branco Ruivo, who has led the Eiffel Tower's operating company (SETE) since 2018, is set to step down at the end of 2026. The departure follows an internal probe that cited "operational flaws and shortcomings" in organizing a Hindu religious group's visit — an incident SETE described as resulting in the "unacceptable" removal of women staff. While this is fundamentally a corporate-governance story, it's a useful reminder of how reputational and cultural-incidence issues can escalate into executive-level consequences for even the world's most iconic landmarks. See Indian Express.
The UN General Assembly (81st Session)
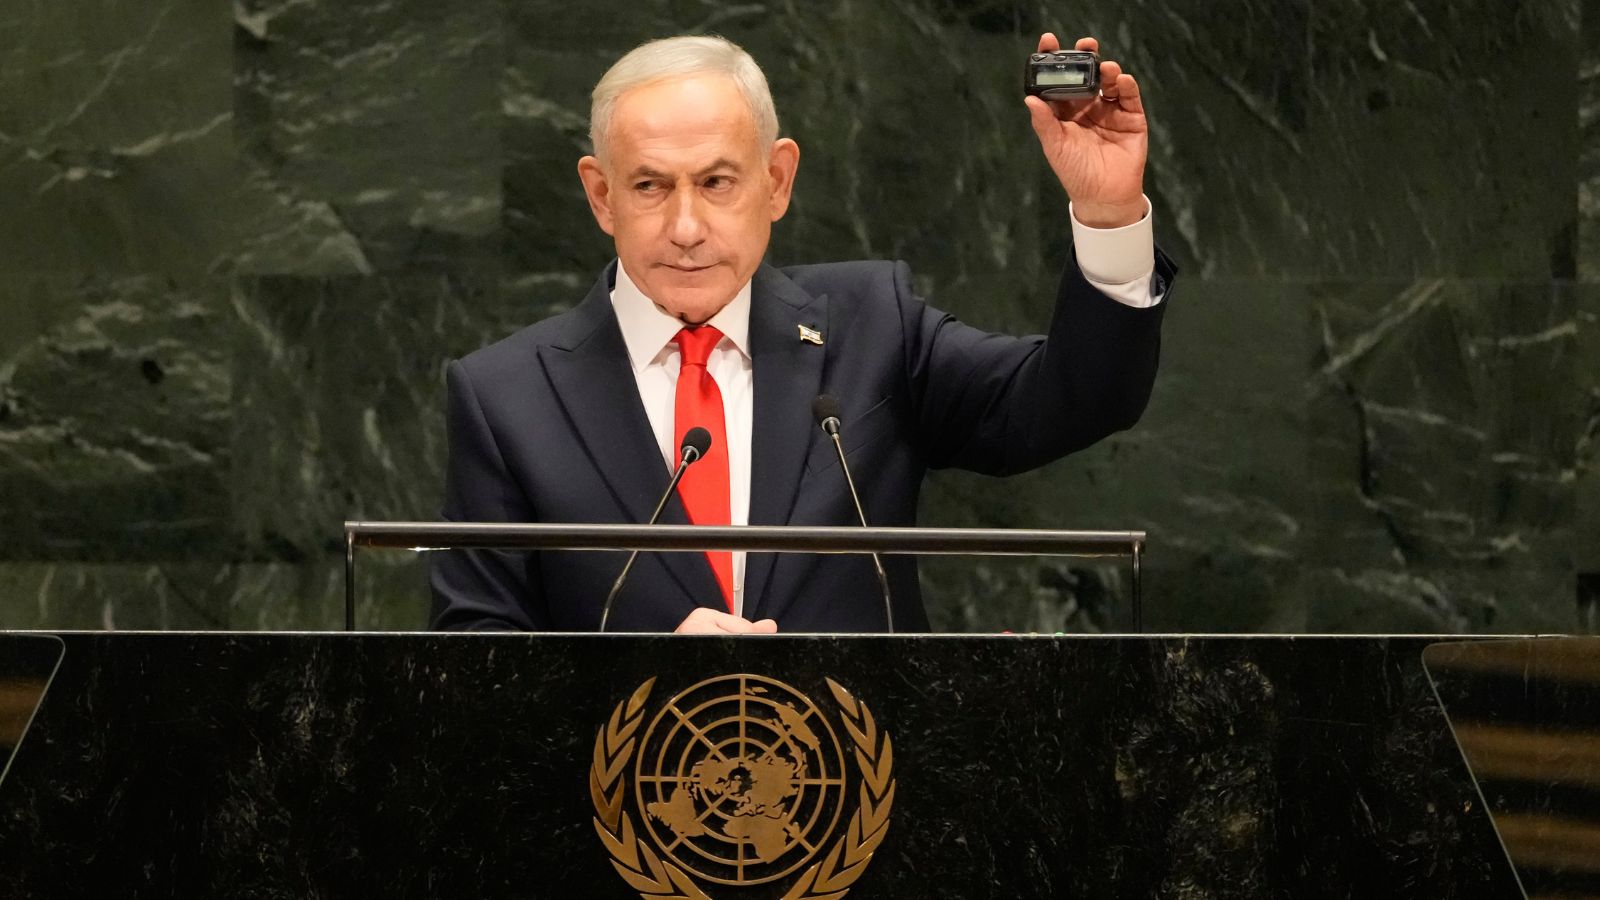
The 81st session of the UN General Assembly has become a forum for some of the era's most intractable problems. Debates have centered on AI and autonomous weapons, nuclear disarmament amid ongoing wars in Iran and Ukraine, and climate action ahead of a projected Paris Agreement overshoot against the backdrop of a looming Super El Niño. Broader systemic concerns threaded through the session include agroecology policy fragmentation in Africa's Congo Basin, refugee funding cuts affecting 8.3 million people, and a record Ebola outbreak in the Democratic Republic of the Congo. Taken together, these threads paint a picture of a multilateral system under simultaneous pressure across security, climate, and public-health dimensions.
Markets Overview
The through-line for markets in late September is simple: oil is the story, and everything else is a reaction to it. Equities, bonds, and currencies are all pricing off energy costs and Fed policy. The result has been a volatile, risk-averse tapestry where even record-breaking tech rallies can't fully overcome inflation fears.
Oil & Energy
Current levels (30 September): Brent crude sits at $96.50 and WTI at $89.72 per barrel — roughly 34% above the ~$72 pre-crisis baseline from February 2026, though both have eased about 1% over the past week. The Brent–WTI spread has widened to $6.78, a telltale sign that seaborne disruption is hitting waterborne Brent harder than landlocked WTI. Other tracked benchmarks: natural gas at $3.031, heating oil at $4.5714, RBOB gasoline at $3.1289, and gold at $4,200.40. See Hormuz Monitor.
The crisis timeline tells the story of a market in turmoil:
- Pre-crisis: Brent traded in a tight $65–75 range, with a February 2026 baseline of ~$72.
- Surge: Prices crossed $100 on March 8, 2026, peaking near $120–126/barrel by late April, with Dubai crude hitting a record $166.80/barrel. See Intellectia.
- Ceasefire: A 60-day ceasefire MOU drove Brent down to ~$83.88 and WTI to $80.96, with European gas falling ~5% and US gasoline retreating below $4.00/gallon; gold anomalously dipped below $4,000/ounce as markets judged the conflict geographically contained. See DiscoveryAlert.
- Re-escalation: By September 11, Brent had reclaimed $104.61 and WTI $100.05 after an effective closure of the Strait of Hormuz removed ~20 million barrels per day from global supply — described as the IEA's largest supply disruption in oil market history, accompanied by a 400-million-barrel coordinated emergency release. See DiscoveryAlert.
- Recent volatility: On September 28, Brent surged more than 3% to ~$107–108 (November futures ~$107.35) after President Trump rejected Iran's proposal to reopen the Strait of Hormuz within seven days. Prices then eased back toward $96 by September 30. See Al Jazeera.
Outlook — where sources disagree: Forecasts are sharply divided. Bull scenarios (Reuters, Rystad) project Brent averaging $134.62 to above $140, with recession risk. Bear scenarios (Goldman Sachs, EIA) see prices fading to ~$85 by year-end and toward $74 in 2027 as demand destruction and substitution take hold. See DiscoveryAlert. A useful middle-ground data point comes from Barclays, which estimates that sustained $100 oil would cut global GDP growth to 2.8% and push inflation to 3.8%, creating genuine stagflationary risks (Intellectia). The disagreement here is the story: hawks fear supply disruption persists; bears believe high prices themselves will eventually kill demand.
Stock Markets
US equities were mixed to lower in late September as oil-driven inflation concerns weighed on sentiment.
- Dow Jones: Closed at 51,349.92 on September 29, down 131.59 points (−0.26%) in a relatively quiet session. The index sits 5.52% below its all-time high of 54,349.12 (August 5, 2026) and just 1.27% from the 52,000 milestone. It's down ~4.13% over the past month but up 10.87% year-over-year and 6.84% year-to-date. Boeing was the top performer (+1.78%); Apple was the laggard (−2.66%), with Walmart, Johnson & Johnson, Nike, and Chevron also declining. See Dow Jones Today.
- Earlier in the week (Sep 23): The Nasdaq hit a record close (27,243.24, +0.45%) driven by AI names like Micron and SanDisk, while the S&P 500 edged down to 7,764.27 (−0.01%) and the Dow fell 0.36% to 51,863.89. Key themes included AI (Anthropic's Claude Opus 5.5, Meta's Muse agent) and Fed commentary, with Boston's Collins warning of elevated inflation risks. See Economic Times.
The tension is visible: AI enthusiasm pushed the Nasdaq to records midweek, but oil-driven inflation fears pulled the broader market down by Friday. Global markets were mixed on September 28 as well — Japan's Nikkei 225 fell 0.73% and South Korea's Kospi dropped 2.70%, while Hong Kong's Hang Seng rose 0.54% and Australia's ASX 200 edged up 0.17% (Al Jazeera).
Bonds & Rates
- Treasury yields (Sep 25 session): The 10-year slipped to 5.17%, the 2-year fell to 4.81%, and the 30-year rose to 5.49%. The curve remains normal and upward-sloping (10Y-2Y +0.36 pp, 10Y-3M +0.93 pp), signaling no near-term recession risk even as the whole curve repriced higher following a broad selloff since midsummer. See Primerates.
- Fed & data calendar: The Fed raised its target range a quarter point to 3.75%–4.00% on September 16 (12–0 vote) after August CPI showed 3.4% headline and 2.4% core inflation, plus 162,000 jobs added at 4.1% unemployment. Market-based inflation expectations are steady at 2.34% (5- and 10-year breakevens). Upcoming catalysts: August PCE (September 30), September jobs report (October 2), September CPI (October 14), and the October 27–28 FOMC meeting.
- The U.S. Treasury published its Daily Treasury Rates on September 29, though specific numeric levels were not extractable from the source (U.S. Treasury.
The notable signal here is the unusual combination: the Fed is raising rates while the curve stays normal and upward-sloping. Typically, a hiking cycle in a risk-off environment flattens or inversions the curve. The fact that it hasn't suggests markets don't see a near-term recession — but the elevated inflation print (3.4% headline) is exactly what makes the stagflation debate so live.
Synthesis: Why This Matters

Three forces are pulling the global economy in different directions simultaneously. First, the Strait of Hormuz crisis has turned oil into a geopolitical swing factor — a 20-million-barrel-per-day supply shock is historically unprecedented, and even a 34% price premium is enough to reshape every asset class. Second, the Fed's decision to hike rather than hold — into an environment of elevated inflation — signals that policymakers are prioritizing price stability over growth support, which is a relatively hawkish stance. Third, the Treasury curve's normalcy implies bond markets are not pricing a recession, creating a subtle contradiction with the equity market's risk aversion.
The honest read is that we're in a data-dependent, headline-driven regime: every ceasefire MOU or rejected proposal sends oil — and therefore everything else — on a rollercoaster. That's why the analyst forecasts are so divergent: the outcome depends almost entirely on whether the Strait reopens, and on how much demand gets destroyed by high prices before then.
Conclusion: Answering the Original Question
To directly answer "what's new today, and what are the markets doing?" as of 30 September 2026:
- Top news: The Eiffel Tower's SETE chief, Patrick Branco Ruivo, is stepping down at year-end after an internal probe into the mishandling of a Hindu religious group's visit; and the UN General Assembly's 81st session is wrestling with AI weapons, nuclear disarmament, and climate action amid a Super El Niño.
- Markets: Oil is the dominant driver — Brent at $96.50 and WTI at $89.72, up ~34% on the year but eased ~1% this week after Trump rejected Iran's seven-day proposal to reopen the Strait of Hormuz. US equities were mixed-to-lower (Dow −0.26%), global markets were mixed, and Treasury yields edged higher with a normal, upward-sloping curve. The Fed holds rates at 3.75%–4.00% with elevated inflation (3.4% headline), leaving the world exposed to either a fade toward $85 oil or a run toward $140 — the two camps are firmly divided.
Bottom line: The world is watching the Strait of Hormuz. Until that supply disruption resolves, expect oil — and therefore markets broadly — to remain volatile, headline-sensitive, and tilted toward stagflationary risk.
If you'd like, I can reframe the investable assets (crude oil, gold, major equities, Treasury bonds) as a ranked "products" comparison with pros/cons and buy channels — just confirm, and I'll clearly flag where I'm extrapolating beyond the provided evidence.