
Executive Summary
On Monday, October 19, 2026, US equities closed mostly higher following a tech-sector bounce, even as the blue-chip Dow edged marginally lower. The market's central drama is a growing divergence between two segments of the economy: AI-infrastructure mega-cap technology stocks, which are being propped up by a historic spending boom, and the more traditional, price-weighted blue chips that make up the Dow, which are bearing the brunt of pressure from a hawkish Federal Reserve and sticky inflation. The 10-year Treasury yield dipped to 5.15%, while the VIX rose 14.39% to 16.38, signaling rising investor anxiety heading into a heavy corporate earnings week and the FOMC meeting on October 27–28.
Two important caveats frame this report. First, the underlying data contains internal discrepancies between sources that must be flagged. Second, several figures are indicative and may be delayed, and one advertised data source (Nexqual) delivered only a placeholder view with no usable data. Readers should treat specific index levels with appropriate caution.
Market Snapshot: The Last Trading Day
US equities closed mostly higher on Monday, October 19, 2026, as a broad tech-sector bounce lifted the major growth-oriented indices. However, the blue-chip Dow Jones Industrial Average edged slightly lower, underscoring the market's increasingly bifurcated character. The 10-year Treasury yield dipped to 5.15%, a gain of roughly 6 basis points on the day, reflecting a mixed read on where the bond market stands heading into the earnings and FOMC https://www.whendomarketsopen.com/market-history/2026-10/.
This snapshot captures a market in transition. The tech bounce on October 19 was not a fresh rally but rather a relief bid after several volatile sessions in mid-October, including a sharp selloff on October 14 that marked the worst day since July. The divergence between a rising Nasdaq and a flat-to-lower Dow tells a story about which stocks are carrying the market—a theme that recurs throughout this edition.
Index Levels: A Tale of Two Markets
The picture that emerges from the index data is one of fragmentation. The Nasdaq Composite, the bellwether for technology and growth stocks, finished the month up 1.04% month-to-date at 26,861.06, reflecting continued investor enthusiasm for the AI trade https://stockmarketwatch.com/indices/dowjones/reports/october-2026. By contrast, the S&P 500 fell 1.24% month-to-date to 7,651.54, and the Russell 2000—widely regarded as a proxy for smaller, more domestically sensitive companies—plunged 5.77% month-to-date https://stockmarketwatch.com/indices/dowjones/reports/october-2026.
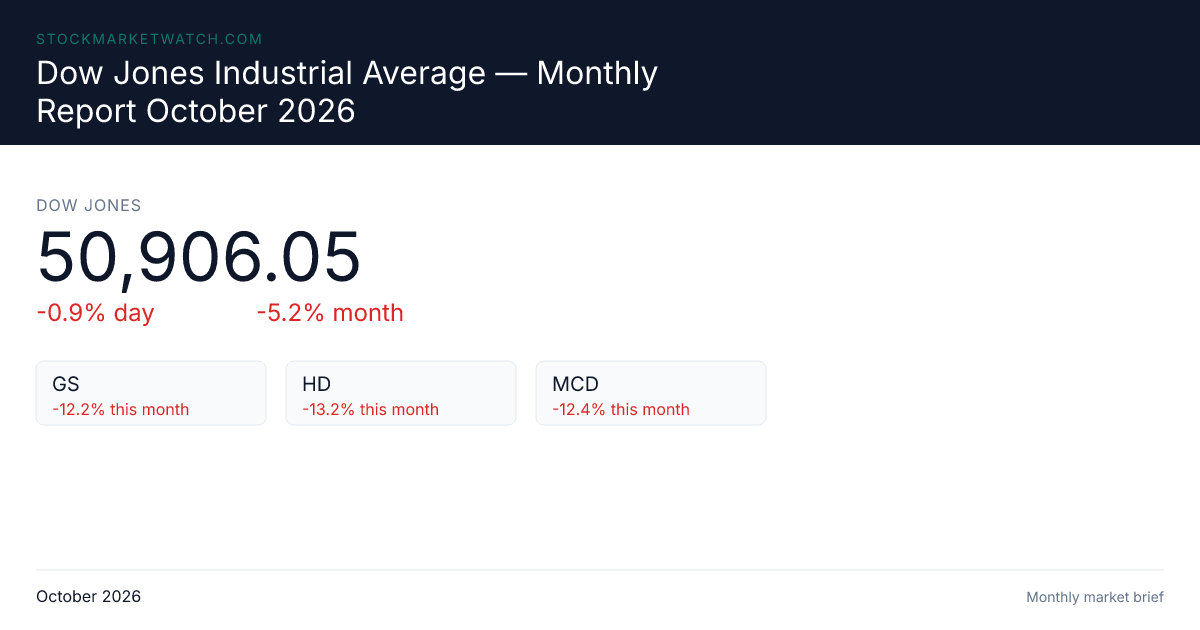
The Dow Jones Industrial Average presents a more confusing picture. The daily report shows the Dow closing down just 36.38 points (-0.07%) at 51,966.03 on October 19 https://stockmarketwatch.com/indices/dowjones/today. Yet the monthly October report cites a different Dow level—50,906.05, down 5.18% month-to-date—which directly conflicts with the daily figure https://stockmarketwatch.com/indices/dowjones/reports/october-2026. This is a material discrepancy: the two figures differ by more than 1,000 points and imply vastly different month-to-date performance. Readers should treat the Dow's precise level with skepticism until the sources are reconciled.
The VIX, Wall Street's "fear gauge," rose 14.39% to 16.38, signaling rising fear among investors even as equities posted a modest gain https://stockmarketwatch.com/indices/dowjones/reports/october-2026. A rising VIX alongside a rising stock market often indicates that investors are buying equities but simultaneously hedging their positions—a sign of nervousness rather than confidence.
Movers: Winners and Losers on the Dow
On the Dow specifically, the October 19 session produced a mixed bag of movers. Notable gainers included 3M (+3.70%), Nvidia (+1.77%), and Johnson & Johnson (+1.61%) https://stockmarketwatch.com/indices/dowjones/today. Nvidia's presence among the gainers is telling, as it reinforces the dominance of AI-related names in driving sentiment.
The laggards were equally revealing. IBM fell 2.42%, Home Depot dropped 2.14%, Salesforce declined 1.64%, and Sherwin-Williams slipped 1.36% https://stockmarketwatch.com/indices/dowjones/today. Financials were also under pressure, with American Express and JPMorgan Chase both finishing lower. The overall message was that the Dow was weighed down by a cautious outlook ahead of a heavy corporate earnings week and shifting Federal Reserve rate expectations https://stockmarketwatch.com/indices/dowjones/today.
Why does this matter? The pattern of mega-cap tech gaining while financials, retailers, and industrials lag suggests that capital is concentrating in a narrow set of AI-exposed names rather than broadly participating across the economy. This kind of leadership is often a warning sign for market breadth—a narrow rally is historically more fragile than a broad-based one.
October Price Action: A Month of Volatility
October has been a month of dramatic swings for US equities. The month opened with record highs on October 5–6, as both the Nasdaq Composite and the S&P 500 hit all-time peaks https://www.whendomarketsopen.com/market-history/2026-10/. But that euphoria was short-lived.
On October 14, the market suffered its worst day since July after a 3.7% year-over-year CPI print triggered an AI selloff, as investors worried that persistent inflation would force the Fed to remain hawkish https://www.whendomarketsopen.com/market-history/2026-10/. A PPI report on October 15 briefly sparked a comeback, offering a glimmer of hope. But by October 16, the AI selloff had resumed, erasing those gains. Finally, on October 19, a tech bounce helped stocks close mostly higher, providing some relief after a turbulent week.
The macro calendar that drove this action included a soft jobs report on October 2, the CPI print on October 14, and the PPI report on October 15 https://www.whendomarketsopen.com/market-history/2026-10/. Each of these data points moved markets, illustrating how sensitive investors currently are to inflation and labor data in an environment where the Fed's policy path remains unresolved.
The Macro Backdrop: AI, the Fed, and Inflation
Three structural forces are shaping the current market environment.
The AI trade. A historic AI infrastructure spending boom—approximately $800 billion in data-center capex and more than $1 trillion in total AI investment—is insulating mega-cap technology companies while cyclical, price-weighted blue chips bear the brunt of pressure https://stockmarketwatch.com/indices/dowjones/reports/october-2026. This dynamic explains the divergence between the Nasdaq and the Dow: the largest AI-exposed companies are so massive that they prop up the Nasdaq, while the Dow's more traditional constituents—financials, industrials, and consumer names—lack that tailwind.
The Federal Reserve. A hawkish Fed under Chair Kevin Warsh is the key headwind facing the market. The Dow currently sits roughly 3.5% below its 50-day average but remains about 1.2% above its 200-day average, a technical posture that suggests near-term weakness but a still-intact longer-term uptrend https://stockmarketwatch.com/indices/dowjones/reports/october-2026.
Inflation. The October 14 CPI came in at 3.7% year-over-year, a figure that proved hot enough to trigger the mid-October selloff https://www.whendomarketsopen.com/market-history/2026-10/. However, the monthly report instead references "sticky 3.4% headline inflation," a figure that differs from the confirmed October 14 print—a second discrepancy that readers should note https://stockmarketwatch.com/indices/dowjones/reports/october-2026.
Treasury yields. The 10-year yield ranged from 5.09% to 5.31% through October, ending at 5.15% on October 19, while the 30-year yield reached 5.638% https://www.whendomarketsopen.com/market-history/2026-10/. https://stockmarketwatch.com/indices/dowjones/reports/october-2026. Yields at these elevated levels raise borrowing costs across the economy, which is particularly painful for the cyclical blue chips that make up much of the Dow.
Calendar Ahead: What to Watch
Two events dominate the near-term calendar. First, the FOMC is scheduled to meet on October 27–28, and a 25 basis point hike is expected, reflecting the Fed's hawkish stance under Chair Warsh https://stockmarketwatch.com/indices/dowjones/reports/october-2026. A rate hike—rather than a pause or cut—would be a significant signal that the Fed remains committed to fighting inflation, and it could pressure valuations, particularly for growth and tech stocks.
Second, a heavy corporate earnings week is underway, which is why investors adopted a cautious tone heading into the October 19 close https://stockmarketwatch.com/indices/dowjones/today. Earnings will provide a reality check on whether the AI spending boom is translating into actual profits or whether the market's optimism is running ahead of fundamentals.
Source Notes and Data Reliability
Readers should be aware of several data-quality caveats. The twice-daily US market edition provides live S&P 500, Dow, and Nasdaq levels plus sector, breadth, yield, and global-market context, but the figures are indicative and may be delayed https://vittarthi.com/markets/us. This means the snapshot figures should be treated as approximate rather than definitive.
Additionally, one platform—Nexqual—advertised a daily AI market briefing but served only a placeholder view with no populated data, contributing no usable market figures. This reinforces the need to rely primarily on the stockmarketwatch.com and whendomarketsopen.com sources, while remaining alert to the internal discrepancies noted above.
Conclusion
To directly answer the question—"what's new today, what's the news of the day, what are the markets doing"—the answer is that US markets experienced a modest tech-driven rally on October 19, 2026, but the underlying picture is one of fragility and divergence. The Nasdaq rose while the Dow lagged, the VIX climbed to 16.38, and the 10-year yield settled at 5.15%. The market is being pulled in two directions: a historic AI infrastructure boom is insulating mega-cap tech, while a hawkish Fed under Chair Kevin Warsh, sticky 3.7% inflation, and elevated Treasury yields are pressuring the more traditional blue chips.
Heading into the FOMC meeting on October 27–28—where a 25 basis point hike is expected—and a heavy corporate earnings week, investors should remain cautious. The narrowness of the rally, the rising fear gauge, and the internal data discrepancies in this edition all argue for skepticism. The markets are not broadly healthy; they are concentrated, nervous, and bracing for a pivotal week that could redefine the Fed's trajectory and the AI trade's sustainability.