
Executive Summary
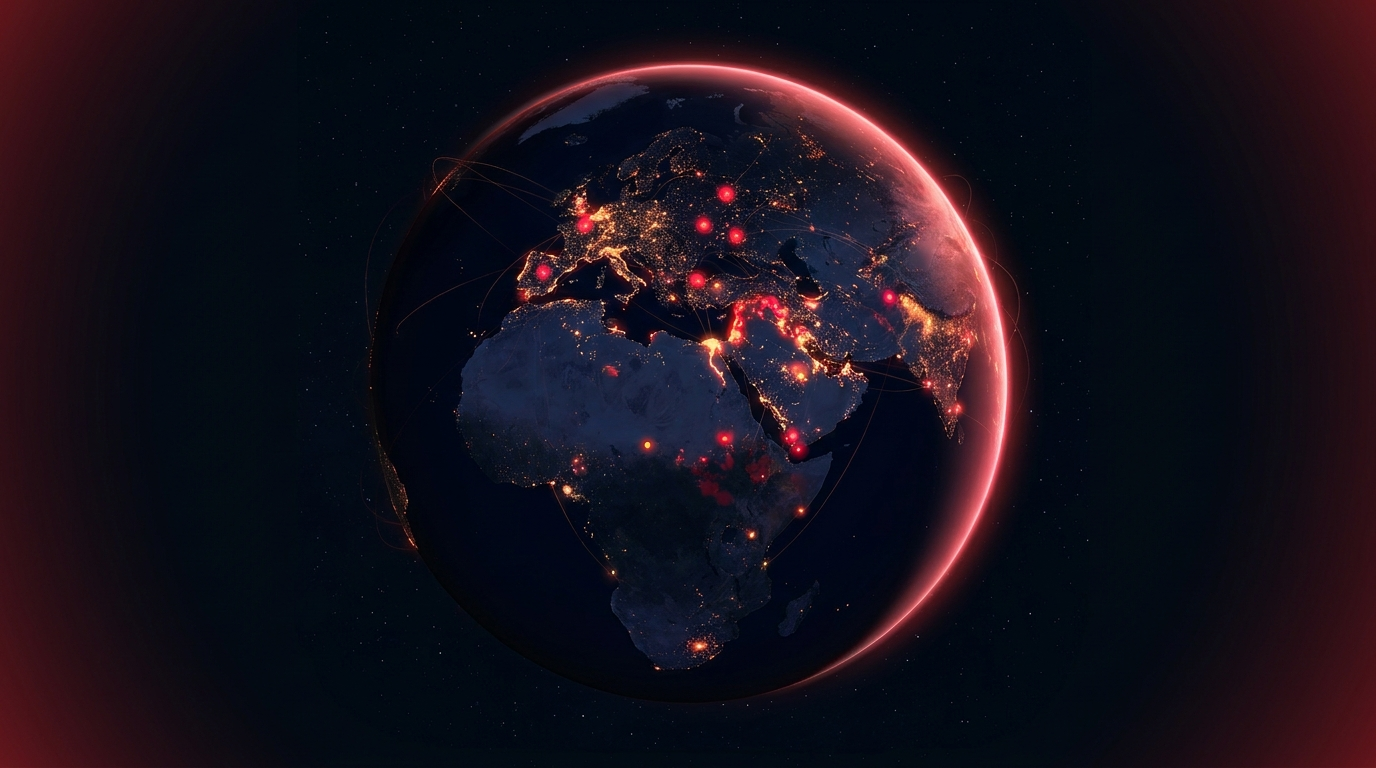
The world on 2026-10-09 is defined by a paradox of simultaneous fragility and resilience. On one hand, armed conflict remains pervasive and, in several theaters, intensifying: the Russia–Ukraine war has now entered its fourth year, the Gaza conflict continues despite stalled ceasefire talks, and a volatile Middle East sees Houthi attacks on Saudi Arabia and reports of explosions in the Strait of Hormuz. On the other hand, the global economy has surprised to the upside, buoyed by an AI-driven investment boom and resilient growth even as central banks hold rates at restrictive levels and sovereign bond yields sit at multi-decade highs.
Three tensions structure this briefing. First, there is no agreed-upon count of the world's conflicts — estimates range from a narrow set of active combat theaters to over 100 armed disputes — reflecting genuine methodological disagreement about what counts as "war." Second, central banks are pursuing unusually divergent monetary policies, with some tightening and others easing, creating fresh volatility in currency and equity markets. Third, economic forecasters themselves disagree sharply: the IMF projects global growth near 3.3% while the World Bank leans toward 2.5%, an 80-basis-point gap that encapsulates a deeper debate about whether AI will deliver a productivity windfall or whether sticky inflation and geopolitical shocks will prevail.
The bottom line: the post-World War II order is being reconstituted along five fault lines — Russia's war on Ukraine, a US war on Iran, US tariffs, China's export penetration, and AI — and the coming year will test whether institutions and markets can manage the resulting fragmentation.
The Global Conflict Landscape
A Disagreed-Upon Count of War
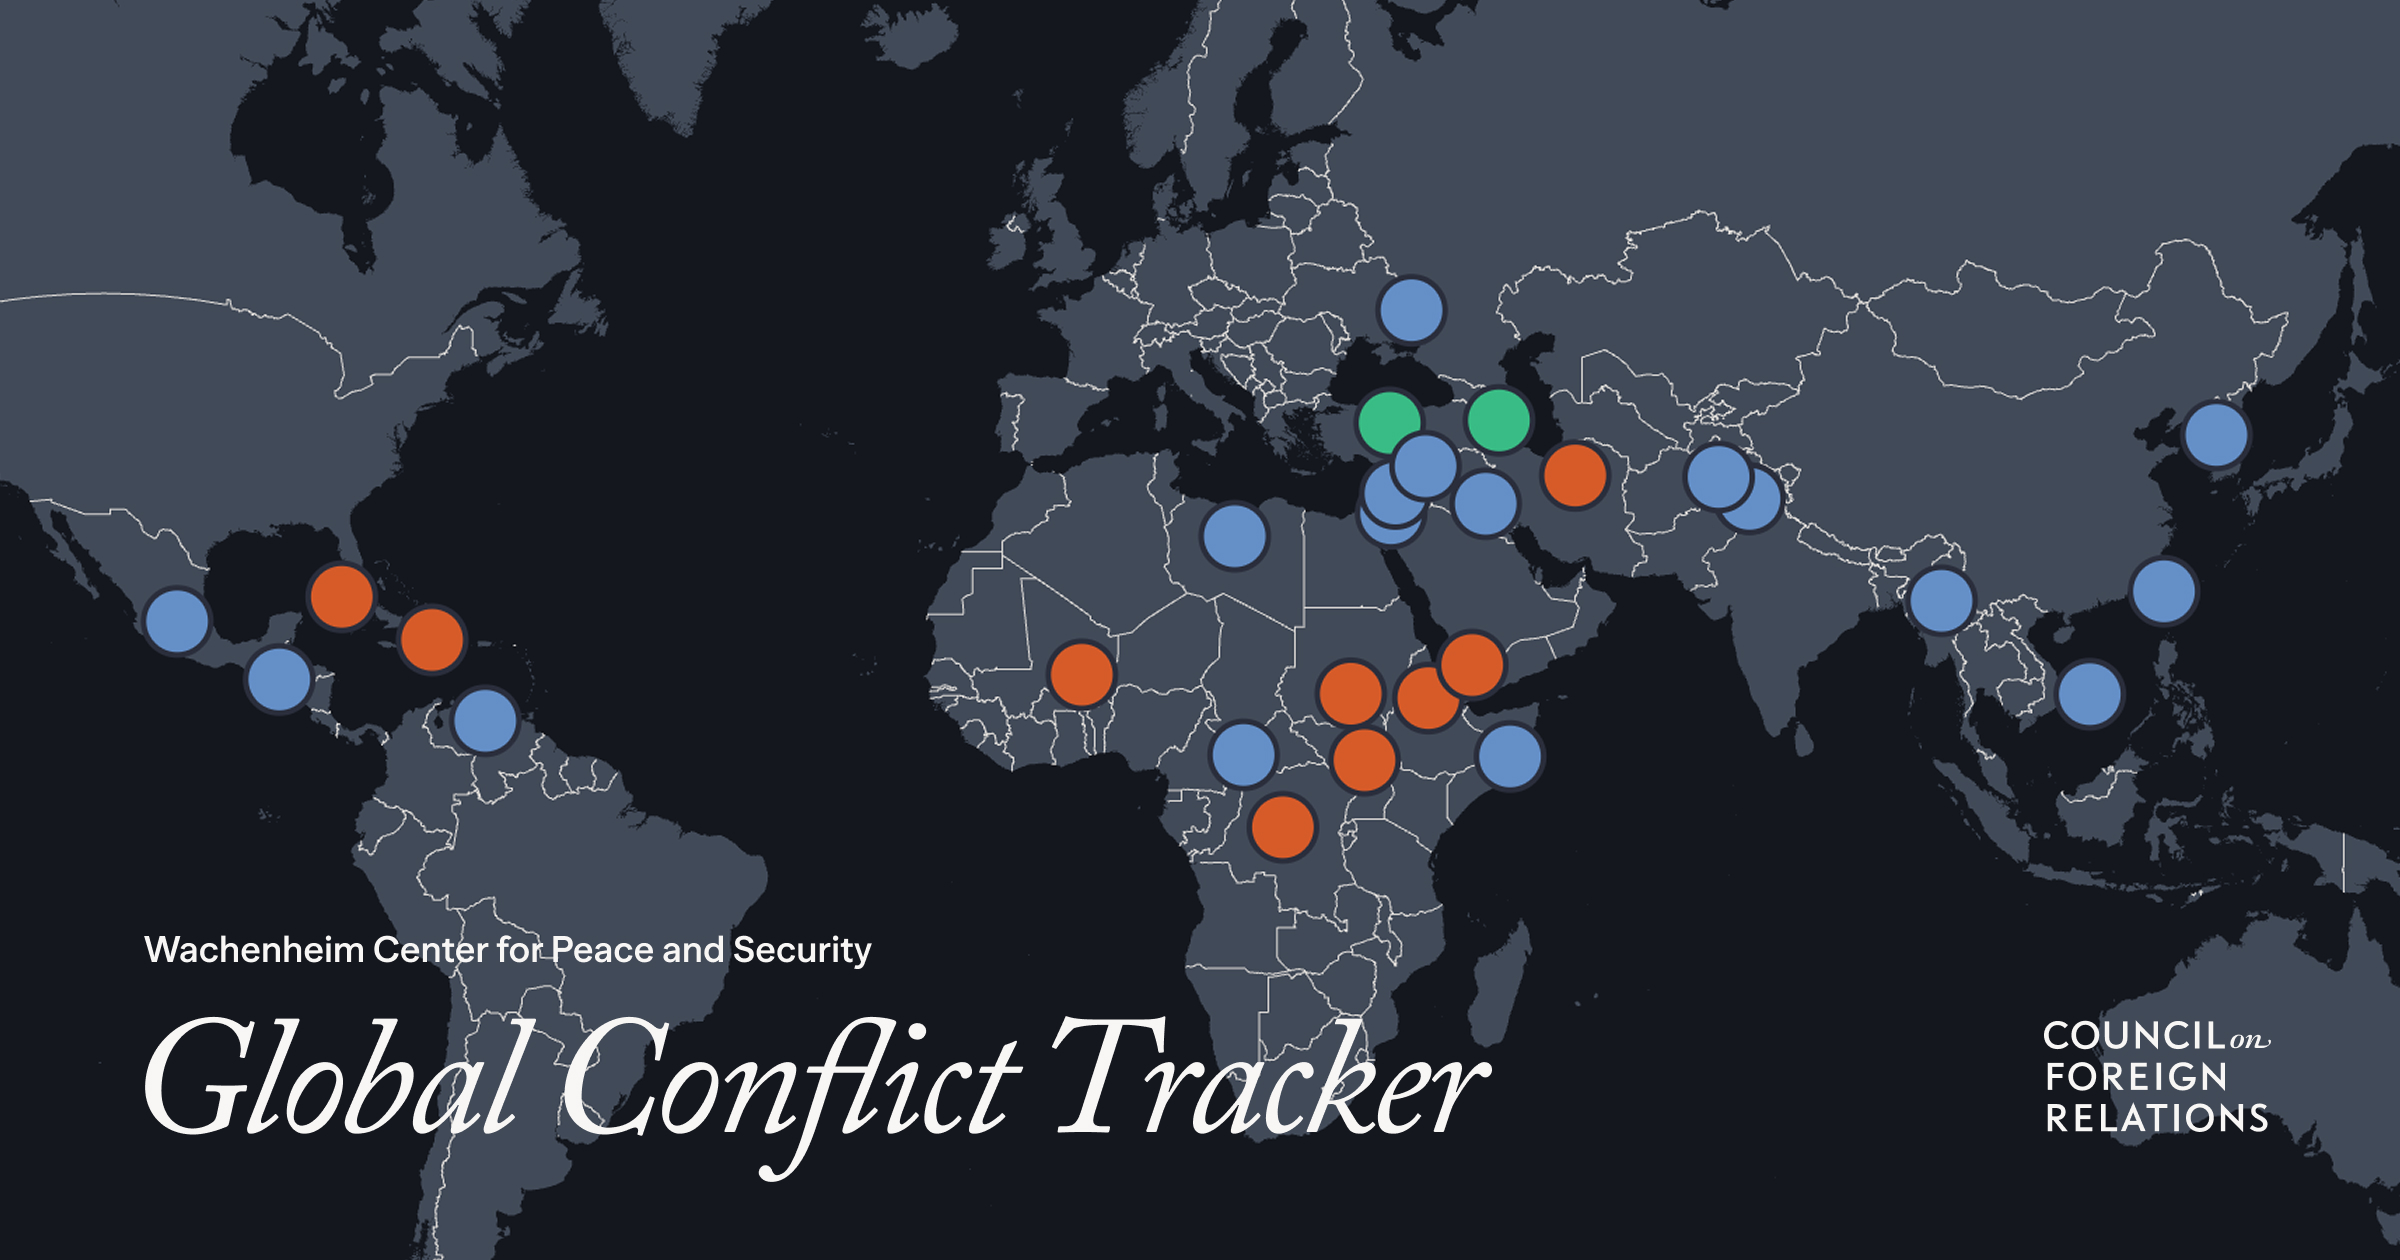
One of the first things any careful reader should notice is that there is no single, accepted tally of the world's active wars. Different trackers measure different things and therefore produce wildly different numbers. The International Committee of the Red Cross (ICRC) cites more than 100 conflicts globally. The Council on Foreign Relations' Global Conflict Tracker monitors 27 by design, focusing on those of strategic interest to Washington. Live war maps identify an even narrower set of theaters with confirmed combat. Meanwhile, event-based trackers such as the Conflict Tracker scan thousands of news sources across dozens of languages to produce daily briefs — with AI drafting layered behind human citation and figure verification. WarData.io · Conflict Tracker
This disagreement is not merely academic. The number you choose shapes how urgently a policy audience treats a given crisis. A reader who trusts the ICRC's "100+" framing will perceive a world in a state of near-total fragmentation; a reader relying on the CFR's 27 will see a more manageable set of hotspots. For a non-partisan synthesis, the honest move is to report all of these figures and explain why they diverge rather than to pretend one is authoritative.
Confirmed Combat and Elevated Pressure
As of 2026-10-09 at 05:03 UTC, a live war map cross-referencing public news feeds and Telegram channels through independent AI models reported six countries with confirmed combat on their own territory: Yemen (safety index 17.8), Russia (36.7), Ukraine (45.8), Lebanon (45.8), Ethiopia (47.0), and Saudi Arabia (67.1). These scores run from 0 to 100, where dark red (0–30) means "extremely dangerous" and green (85–100) means "very safe." Notably, Yemen alone sits in the "extremely dangerous" band, while Saudi Arabia — a country that would traditionally be considered stable — registers active combat, underscoring how the region's threat profile has shifted. Strike markers on such maps require confirmation by two independent models before appearing and fade as the 24-hour window closes, a design choice meant to reduce noise but also a reminder that these are near-real-time estimates, not ground truth. WarData.io
An additional 15 countries sit under "elevated military pressure" without a confirmed strike, including Mali (Kidal), the DR Congo (a Masisi ceasefire under strain), Yemen (a Taiz siege), Sudan and South Sudan (overwhelmed trauma wards), and Afghanistan. This distinction between "confirmed combat" and "elevated pressure" matters: the latter often foreshadows the former.
The Four High-Consequence Conflicts
Four conflicts carry the highest consequence according to the monitored data:
- Russia–Ukraine War — High Intensity, Escalation Index 71, now on Day 1553 of the invasion, with ongoing Sumy incursions and escalating deep strikes on the Moscow region and Russian drone units.
- Gaza Conflict — High Intensity, Escalation Index 84 (the highest of the four), with ceasefire negotiations at an impasse.
- Sudan Civil War — Active, Escalation Index 67, producing a severe humanitarian crisis.
- Iran–Israel Shadow War — Elevated, Escalation Index 58, a proxy campaign spanning Lebanon, Syria, and Yemen. WarData.io
The Gaza conflict's escalation index of 84 — higher than Russia–Ukraine's 71 — is a striking data point. It signals that, in the monitored period, the intensity of fighting in Gaza exceeded even the high-intensity war in Ukraine, even as the war in Ukraine has consumed far more cumulative time and resources.
Broader Context and Casualty Tally
The Uppsala Conflict Data Program (UCDP) places the number of active armed conflicts worldwide at approximately 56 as of 2026, with at least 10 major wars driving significant casualties and displacement. The deadliest, by this accounting, are the Russia–Ukraine war (500,000+ casualties since February 2022), the Sudan civil war (SAF vs. RSF, since April 2023, with 150,000+ killed and 10 million+ displaced), and the Israel–Gaza conflict (since October 2023, with 40,000+ killed and regional spillover into Lebanon, Yemen, and Iran-backed militias). Other notable conflicts include Myanmar's civil war (post-2021 coup), the DRC conflict (M23 and more than 100 armed groups), and Sahel insurgencies in Mali, Burkina Faso, and Niger. War Today
Here we see a genuine disagreement between sources: the UCDP's ~56 conflicts sits between the CFR's 27 and the ICRC's 100+. A careful reader should treat these as complementary lenses rather than competing truths — the UCDP's methodology is the most academically rigorous, the CFR's is the most policy-relevant to the US, and the ICRC's is the most inclusive of lower-intensity disputes.
Regional Flashpoints
The most consequential developments cluster in the Middle East: Houthi attacks on Saudi airports in Riyadh, Iranian reports of explosions in the Strait of Hormuz, and continued Israeli strikes in Gaza despite a stalled ceasefire. In Ukraine, Russian strikes on public transportation — buses in Kramatorsk and near the frontline — have killed dozens, a pattern that targets civilian infrastructure. Elsewhere, India and Turkiye are exploring new truce proposals, a quiet diplomatic thread that deserves monitoring. conflictmaplive.live
The Global Economy: Resilience Amid Fragmentation
An Unexpectedly Resilient Q3
The global economy has proven unexpectedly resilient in Q3 despite the very wars and disruptions described above. Five major disruptions are identified as fragmenting the post-WWII international order: Russia's war on Ukraine, the US war on Iran, US tariffs, China's export penetration, and AI. Against this backdrop, the US economy has surprised on the upside, with Q3 growth running around 3.7% per GDPNow, increasingly driven by AI-related capital investment. Marc to Market
This resilience is the single most important economic story of the moment, and it deserves scrutiny. Growth of 3.7% is robust by any historical standard, yet it is being driven by a factor — AI capex — that analysts debate is either a genuine productivity revolution or a speculative bubble. The synthesis here is that the economy is riding a genuine investment wave while simultaneously facing structural headwinds; neither pure euphoria nor pure doom captures the reality.
The Repricing of Money
If growth has surprised to the upside, borrowing costs have surged. Central banks across the G4 — the Fed, ECB, BOJ, and BOE — have raised or held rates, and sovereign bond yields have hit multi-decade highs: the US 10-year yield sits around 5.29% and the 30-year around 5.62%. At the country level, gross-debt snapshots rate Japan, the United States, and France as the highest-risk economies — a notable finding, since these are among the world's most financially developed markets. Global Economy Report October 2026
This is a critical and somewhat counterintuitive development. For much of the 2010s and early 2020s, the prevailing assumption was that low inflation and central-bank credibility would keep borrowing costs contained. The October 2026 data suggest that assumption has broken down: investors are now demanding substantially higher yields to hold long-duration sovereign debt, and they are pricing Japan, the US, and France as particularly risky. This repricing has profound implications for everything from housing affordability to government deficit financing.
Central Bank Policy: Divergent Paths

An Unusually Wide Policy Dispersion
As of late 2026, global central banks are pursuing divergent monetary policies in a way that is historically unusual. Those that have tightened include the Fed (4.0%), ECB (2.5%), BoJ (1.25%), RBA (4.6%), RBNZ (2.75%), and SARB (7.25%). Those that have eased include Brazil (13.75%), Canada (2.25%), BoE (3.75%), SNB (0.0%), the PBoC, and the Riksbank. Central Bank Policy Outlook 2026
This dispersion is consequential because it reshapes interest rate differentials, currency flows, and rate-sensitive equity sectors worldwide. The divergence coincides with mixed US data: a soft jobs report (29 payrolls created versus 89 forecast, with unemployment at 4.2%) alongside resilient GDP (2.2%) and a Chicago PMI jump to 58.8 — a reading well into expansionary territory. Meanwhile, eurozone inflation is accelerating to 3.8% CPI, complicating the ECB's calculus. The result is a source of fresh volatility that markets are still learning to price.
Consolidation at Neutral Rates
A second theme is that inflation is mixed. Core pressures are easing, but service prices remain high due to wages, marking what analysts describe as the end of rapid disinflation. Central banks — the Fed, ECB, and Bank of England — are consolidating at neutral rate levels, communicating in a data-dependent manner while continuing balance-sheet reduction. The advice flowing from this analysis is sober: investors should favor diversified, long-term strategies focused on real returns, given structural inflation and uncertain economic momentum. Mueckinvest
The phrase "the end of rapid disinflation" is the key insight of this section. For roughly a decade, the global economy enjoyed a steady decline in inflation that let central banks act with confidence. That era appears to be over, replaced by a stickier, more stubborn inflation environment that will keep policy uncertain for longer.
Investment Outlook: A Constructive but Cautious View
The Bull Case for 2027
The outlook heading into 2027 is constructive. Healthy risk appetite is supported by strong economic growth, booming AI capex, solid labor markets, and robust corporate fundamentals — record profit margins, tight credit spreads, and high-yield yields near 8.0% in the US and 7.0% in Europe. The G4 central banks remain in a rate-hiking mode to combat sticky inflation above 2.0% targets, but a slow drift lower in yields is expected as inflation cools, with no significant bond rally anticipated. Currencies are seen as range-bound, with the US dollar unlikely to decline significantly until a possible late-2027 Fed pivot. Select emerging-market markets — Brazil, Colombia, Mexico, Hungary, South Africa, New Zealand, and Australia — offer attractive local-currency exposure. Global equities are favored, especially large-cap US and non-US growth equities, valued attractively with the AI theme still in its "early innings." Key risks include impatient central banks, oil disruptions via the Strait of Hormuz, AI regulatory crackdowns, and demanding 2027 earnings growth expectations exceeding 13%. Loomis Sayles
Currency Markets
On the currency front, the dollar rallied in September, with the yen appreciating roughly 1.5%, while the euro, pound, Canadian dollar, and Australian dollar fell. The forward bias is toward a consolidative to weaker dollar. Marc to Market
Taken together, the investment outlook presents a coherent but internally tense picture: optimism about growth and AI is real, but it is predicated on inflation cooling without a recession — an outcome that is far from guaranteed given the sticky service inflation and restrictive policy described above.
Economic Forecasts: The IMF–World Bank Divide
An 80-Basis-Point Gap
The clearest illustration of analytical disagreement comes from the two most authoritative global forecasters. 2026 global growth is forecast between 2.5% (World Bank) and 3.3% (IMF) — an 80-basis-point spread driven by divergent assumptions on inflation, energy, and geopolitics. The IMF's optimism rests on soft landings and AI productivity gains; the World Bank's caution assumes stickier inflation, higher rates for longer, and a possible supply shock. Asia — led by India at 6.0–6.5% — is the primary growth engine, while developed economies grow more slowly (US 1.8–2.2%, eurozone 1.2–1.5%). Central banks are expected to cut rates, with the exception of the Bank of Japan's normalization. Key tail risks include geopolitical escalation, energy supply shocks, and elevated government and corporate debt, any of which could push growth toward 1.8–2.2% and trigger recessions. Global Economic Outlook 2026
This 80-basis-point gap is the single most important number in the economic section, because it quantifies the fundamental uncertainty at the heart of the global outlook. The IMF and World Bank are looking at the same world but weighting the AI upside and the inflation/geopolitical downside differently. For a reader, the takeaway is that the consensus is genuinely contested, and the downside risks — escalation, energy shocks, debt — are severe enough to knock growth down toward recessionary levels.
Conclusion: Answering the Question
So, what is happening today, and what is new? On 2026-10-09, the world is navigating a period of simultaneous resilience and fragmentation. The most consequential developments fall into three buckets.
First, conflict is both more numerous and more intense than ever measured before. With estimates ranging from 27 (CFR) to 56 (UCDP) to 100+ (ICRC), there is no agreed count — a disagreement that itself signals how widespread armed dispute has become. The Gaza conflict's escalation index of 84 — the highest of the four high-consequence conflicts — and Saudi Arabia's registration of active combat mark a genuinely new and dangerous phase of Middle East instability, even as the Russia–Ukraine war enters its fourth year.
Second, the global economy has surprised to the upside but at a rising financial cost. Q3 growth near 3.7% and an AI-driven investment boom have defied pessimists, yet sovereign yields at multi-decade highs and a repricing that flags Japan, the US, and France as highest-risk reveal that this resilience is being purchased with expensive borrowing.
Third, the institutions that manage the global economy are divided. Central banks are pursuing divergent policies at an unusual pace, disinflation has stalled, and the IMF and World Bank are 80 basis points apart on the growth outlook — a gap that encapsulates a deeper debate about whether AI will deliver a windfall or whether sticky inflation and geopolitics will prevail.
The answer to the question, then, is this: the world on 2026-10-09 is being reconstituted along five fault lines — Russia's war on Ukraine, a US war on Iran, US tariffs, China's export penetration, and AI — and the central challenge of the coming year is whether growth, markets, and diplomacy can manage this fragmentation without tipping into recession or wider war. The evidence suggests resilience is real but fragile, optimism is justified but contested, and the margin for error has never been thinner.