

Executive Summary
The world on October 2, 2026 is defined by a paradox: an economy that appears to be running hot alongside a global supply system that is quietly fraying at multiple seams. The composite geopolitical risk score sits at an EXTREME 89, with 100 active conflict events and six designated hotspots, yet the largest single story of the week is not a shooting—it is a copper crisis born from the collision of Middle East energy disruption, Congolese export policy, and the insatiable demand of electrification and AI infrastructure.
Three interlocking themes emerge from this edition. First, the high-tariff trade order is consolidating, reshaping where minerals, fuel, and finished goods flow. Second, the energy supply chain is under acute stress, with the Strait of Hormuz at the center and a global diesel crunch rippling through India, Taiwan, and Pakistan. Third, markets are repricing risk upward, with the U.S. 10-year Treasury yield at its highest since 2007 and the Fed now pricing a likely October hike. Beneath all of this, a strategic competition over critical minerals—most visibly between the DRC's resource nationalism and China's processing dominance—has become a defining theater of the U.S.–China rivalry.
This report synthesizes the evidence, weighs where sources agree and where they conflict, and explains why these developments matter beyond the headlines.
Global Risk Overview: An Elevated Plateau
The global threat environment no longer resembles a series of discrete crises; it resembles a structural plateau of elevated risk. A live geopolitical risk dashboard reports a composite score of 89 (EXTREME), backed by 100 active conflict events, 9 critical alerts, and 6 designated hotspots—Ukraine, Yemen, Iran, Saudi Arabia, Sudan, and Ethiopia. The methodology behind such tracking matters as much as the number: it is designed to capture enduring structural competitions rather than one-off shocks, and to map their escalation mechanisms. Notably, 2026 nuclear risk is flagged as a distinct concern, a signal that analysts view the current moment as one where conventional competition could metastasize into something far more consequential.
Why this matters: when risk scoring systems emphasize structural competition—Russia–Ukraine, U.S.–China, Middle East instability—they are implicitly arguing that volatility is now the baseline, not the exception. The presence of market-exposure and severe-weather/volcano threat drivers affecting the United States further illustrates how the modern risk landscape blends geopolitical, financial, and physical hazards into a single composite. For policymakers and investors alike, the lesson is that resilience requires planning for simultaneous, cross-domain shocks rather than isolated events.
Economic & Markets: Resilience Meets Repricing
The Macro Backdrop
The global economy is resilient but increasingly diverging. Oxford Economics' 2026 outlook identifies three dominant structural themes shaping the year ahead: the consolidation of a new high-tariff global trade order, artificial intelligence's shifting role as either a shock absorber or a magnifier of economic stress, and the growing centrality of fiscal policy. Regionally, the picture is uneven. The United States leads on "exceptionalism" amid trade renegotiations and fragmentation; Asia remains the brightest but unevenly growing region; Europe faces lacklustre, divergent growth; and emerging regions including Africa and the Gulf show mixed signals.
U.S. Data: Overheating or Just Strong?
The most consequential economic data of the week arrived on October 1. The U.S. Composite PMI surged to 58.4—its highest since July 2021—with input costs rising at the fastest pace in four years. This was corroborated by August retail sales beating forecasts (+1.2%), reinforcing a picture of an economy that is both overheating and resilient. The interpretation matters enormously: strong demand is good for growth but complicates the Federal Reserve's job, because it argues against rate cuts at a moment when supply-side disruptions are pushing prices up.
The reaction was immediate and severe in bond markets. The 10-year Treasury yield jumped to its highest level since 2007 (~5.1%), capping a steady 2026 climb that ran from 4.32% in April to 4.68% by August. This repricing lifted market odds of an October Fed rate hike to roughly 70–73%; the Fed had most recently hiked to 3.75%–4%, its first increase since July 2023. In other words, the U.S. is in an unusual position—strong growth and rising inflation and higher-for-longer rates—rather than the conventional stagflation or slowdown scenario.
Transmission Across the Economy
The elevated yield is not an abstract number; it is transmitting across mortgages, AI-related borrowing, and defense budgets—channels with broad implications for growth-sensitive sectors. Higher borrowing costs threaten to cool the very AI infrastructure investment that is supposed to drive future productivity, creating a subtle tension at the heart of the current cycle.
Markets themselves traded mixed on October 1, reflecting the tension between growth resilience and risk repricing: falling stocks alongside a broad yield-curve rally. Elsewhere, the Bank of England held at 3.75% as inflation rose to 3.1%, and corporate signals were mixed—Nike reported revenue that missed with Greater China down 22%, a telling signal about consumer weakness in one of the world's most important markets.
Energy & Supply Security: The Strait of Hormuz Crisis
A Widening Energy Crisis
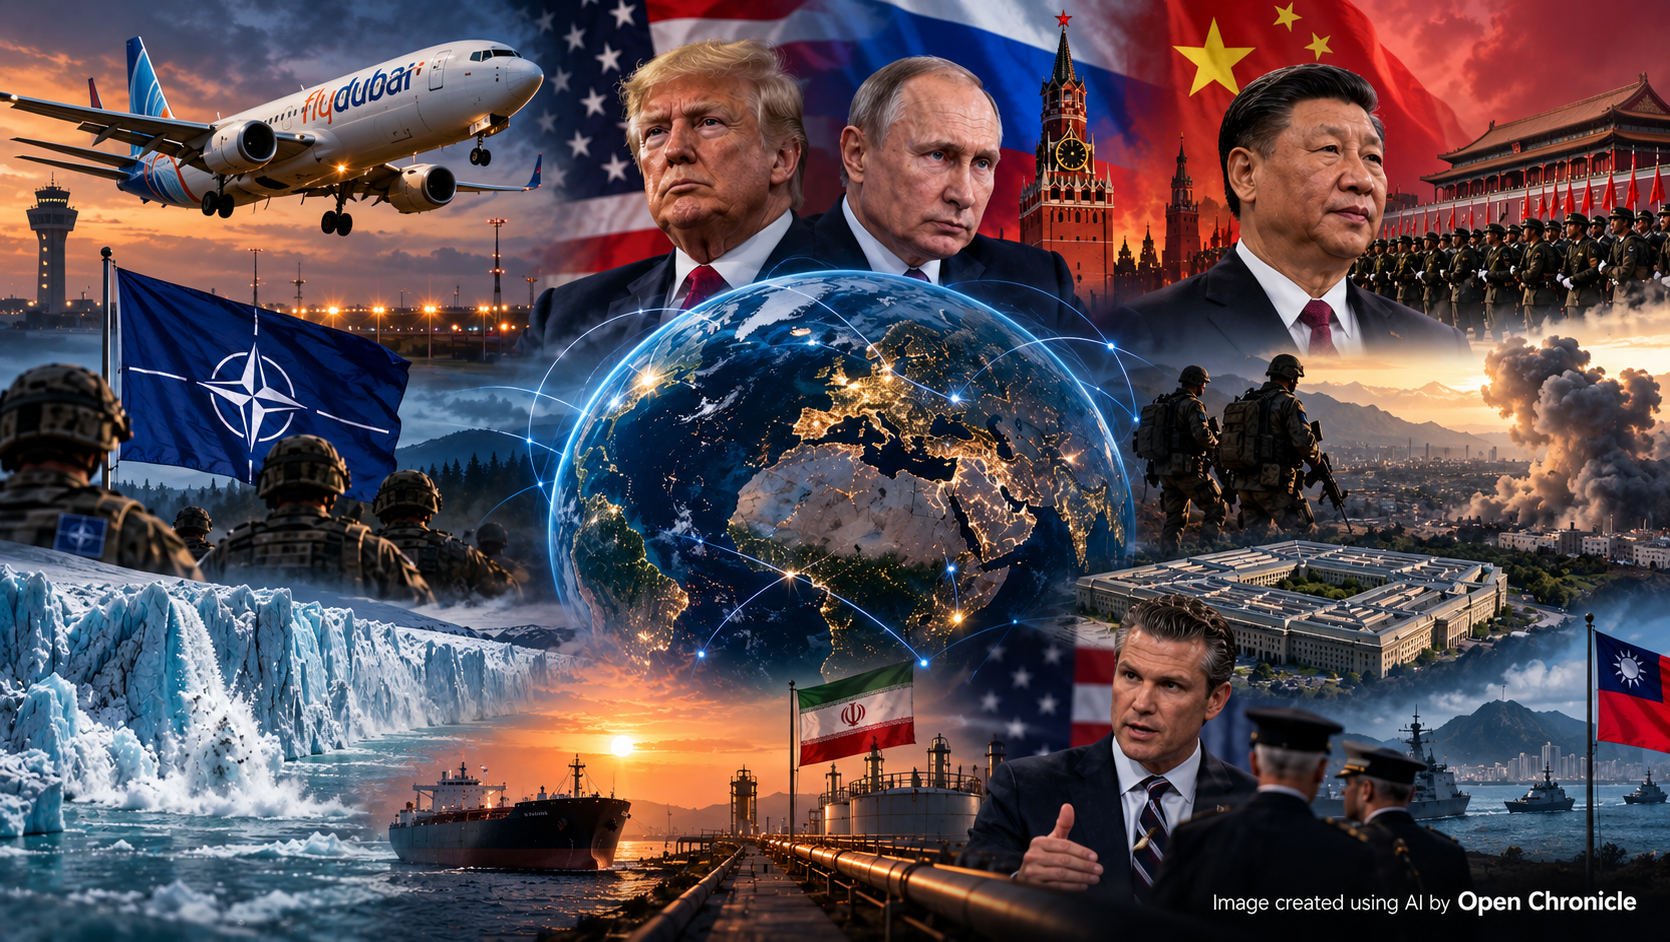
Perhaps the most alarming development of the edition is a widening energy and commodity crisis centered on the Strait of Hormuz. Iran has threatened energy infrastructure, and tankers have been struck by unknown projectiles—a pattern consistent with the asymmetric warfare the region has become known for. The tensions have driven a global diesel crunch, with cascading consequences: China and Russia have imposed fuel export bans, India faces three-year-high power shortages and a refinery blast, and Taiwan and Pakistan are seeking protective measures and LNG imports.
U.S. policy is itself in focus, with threats of a diesel export ban and the Strategic Petroleum Reserve at its lowest since 1982. Washington has reportedly been pressing France and Germany on diesel reserves, an unusual signal that even European allies are being drawn into the crisis management.
Why this matters: the Strait of Hormuz handles roughly a fifth of global oil throughput. A disruption there does not merely raise prices—it threatens to fragment the global fuel supply in ways that hit developing economies hardest. India's power shortages and refinery blast, for instance, are not abstract market movements; they translate directly into energy access for hundreds of millions of people.
The Acid Supply Shock
The Hormuz disruption has direct spillovers into industrial supply chains. The closure—combined with China's sulfuric acid export ban—has erased roughly 25% of global acid supply, a key input for copper refining, notably Chile's SX-EW process and DRC output. This is a critical, often-overlooked link: without sulfuric acid, copper cannot be efficiently extracted from oxide ores, and the disruption feeds directly into the minerals crisis described below.
Critical Minerals & Supply Chains: The Copper Crisis
The Congolese Disruption
Concentration risk in critical minerals has hardened into a full supply crisis, with copper at the center. The linchpin is the DRC's June 29 order (reaffirmed August 6) banning exports of copper and cobalt concentrate, modeled on Indonesia's 2020 nickel strategy and signed by its Mines, Foreign Trade, and Economy ministers. The aim is explicit: to transform the country from a raw exporter into a regional processing hub. The ban takes effect immediately, with possible one-year waivers and a three-month transition for a new taxation framework, including a 55% valuation coefficient on trace by-products.
The market reaction was swift: the ban triggered a 1.8% copper surge to $14,369.50/tonne on the London Metal Exchange by August 6.
Compounding Shocks
The disruption compounds multiple simultaneous shocks. Zijin Mining's Kamoa-Kakula complex in the DRC faces flooding that could cut full-year output by up to 57,000 tons, following seismic activity that halted operations last year. Chile's Codelco has halted its El Teniente expansion. A year of disruptions across Grasberg, El Teniente, and Kakula has pushed copper into a near-term projected 400,000-ton deficit, with prices at record highs—a Comex record of $6.7045 per pound (over 50% year-over-year) and LME inventories falling below one day's global consumption, flipping the market into backwardation (a condition where near-term prices exceed future prices, signaling acute present scarcity).
Demand That Won't Slow
The crisis is not purely supply-driven. Demand remains strong—projected to rise 50% by 2040, with a potential 10-million-metric-ton deficit—driven by electrification and AI infrastructure investment. This threatens capital costs for data centers, EVs, and renewable grids, meaning the energy transition itself may be constrained by the very materials it requires.
The Tariff Fragmentation
U.S. policy is amplifying the fragmentation. Section 232 targeted tariffs (introduced August 2025) impose up to 50% levies on semi-finished products while raw concentrates from Chile and Canada remain largely exempt. This is fragmenting trade, shifting physical supply toward U.S. markets and driving a 200,000+ metric-ton surge of copper into U.S. ports ahead of potential duties.
The Cobalt Dimension
The cobalt side is being reshaped by the DRC's 96,600-tonne annual export quota for 2026–2027 (replacing a 2025 ban), which is driving miners to pivot to copper and prompting the DRC to use its market leverage to court Western buyers and refining capacity—such as a Trafigura deal for an Arizona refinery—as part of a broader geopolitical contest with China over mineral control. China's dominance over neodymium magnet processing continues to shape the global clean-energy and defense-industrial base, and these dynamics sit at the heart of competing infrastructure strategies in Africa—Washington's Lobito Corridor versus China's Belt and Road—framing the mineral supply chain as a theater of strategic competition.
Where Sources Disagree
There is an important counterpoint that persists: the DRC government maintains that 2026 copper and cobalt production has remained largely unaffected, attributing resilience to long-term supply agreements, strategic inventories, and alternative regional suppliers, with Q1 2026 copper exports up 4.8% year-on-year to 823,887 tonnes. This creates a genuine analytical tension. The crisis narrative—supported by record prices, falling inventories, and multiple physical disruptions—suggests acute scarcity, while the government's data suggests market adaptation. The likely truth is somewhere in between: headline supply has held, but margins, investment signals, and forward markets are screaming about future constraint. Readers should treat the "unaffected" claim as a political statement by a government asserting sovereignty over its resources, rather than a neutral market assessment.
Geopolitical Flashpoints: A Multipolar Moment

Regional developments span multiple theaters, reinforcing the picture of a world fragmenting into competing alignments.
- MENA: An Israel–Somiland recognition arrangement has generated diplomatic friction, complicating the regional calculus and potentially reshaping Red Sea dynamics.
- Africa: The Lobito Corridor versus Belt and Road competition continues, alongside India's ongoing infrastructure delivery challenges—a reminder that even large economies struggle to build the physical assets the new economy demands.
- Multipolar diplomacy: Indonesia's President Prabowo has advanced BRICS-related diplomacy, signaling continued expansion of alternative institutional alignments that challenge Western-led frameworks.
- Technology-strategy: Russia's Rassvet satellite constellation is advancing as a domestic Starlink replacement, deepening the fragmentation of global space-based communications—a development with serious implications for both civilian connectivity and military resilience.
- Diplomatic shifts: The U.S. waived rights conditions on $320 million in Egypt military aid, and Eritrea severed ties with Ethiopia following an embassy order, illustrating how even aid and diplomacy remain entangled with geopolitical conditionality.
Parallel reporting from a global news brief covering the Middle East, Europe, Asia, and the United States corroborates the breadth of concurrent activity, confirming that these are not isolated incidents but features of a broadly multipolar and competitive year.
Synthesis: Why Everything Connects
The through-line across this edition is interconnection. The copper crisis is not merely a commodities story—it is an energy story (acid refining depends on fuel), a trade story (U.S. tariffs redirect physical flows), a technology story (AI and EV demand), and a geopolitics story (the DRC courting the West over China). Similarly, the strong U.S. economy is not purely good news—it is a driver of higher yields, which raise borrowing costs for exactly the infrastructure projects needed to meet mineral-constrained demand.
The most important insight is that the era of cheap, abundant, and freely flowing resources is over. Whether measured in diesel, copper, or cobalt, the world is confronting the physical limits of its own transition. The strategic competition over minerals—framed by Lobito versus Belt and Road—will likely define the next decade of great-power politics as much as any military confrontation.
Conclusion

The World Brief for October 2, 2026 paints a picture of a world at an elevated risk plateau (score 89) where the dominant danger is not a single explosive event but a convergence of supply-chain, energy, and trade pressures. The U.S. economy is hot and resilient, pushing bond yields to 2007 levels and forcing the Fed toward a likely October hike. The Strait of Hormuz crisis is threatening global fuel supplies, while the copper and cobalt supply crisis—driven by Congolese export bans, Chinese acid export controls, and surging AI/electrification demand—risks constraining the energy transition itself. Sources disagree on the severity, with the DRC insisting production has held steady, but the market signals—record prices, sub-one-day inventories, and backwardation—argue that future constraint is already pricing in.
In direct answer to the question: The consequential developments of this edition are a high-tariff trade order consolidating, an energy supply crisis centered on Hormuz, a copper-led critical minerals shortage, and a multipolar realignment—collectively signaling that the global economy is growing even as its physical foundations become more fragile and more contested. The era of abundance is giving way to an era of scarcity and strategy, and those who plan for it will be best positioned for what comes next.