

Executive Summary
October 2026 was a month of sharp regime shifts, defined less by a single directional theme than by the market's repeated attempts to reconcile record-high valuations with mounting structural doubts. The tape moved in three distinct phases: an early-October broadening rally that suggested healthy participation, a mid-month record-high session carried almost entirely by a handful of AI-adjacent mega-caps, and a late-month risk-off reversal triggered by resurfaced fears about the sustainability of AI capital expenditure. Across the arc, the dominant narrative was a rotation—away from AI hyperscalers and semiconductor names and into energy, small caps, and defensive yield sectors.
The evidence points to a market in tension. On the constructive side, genuine breadth improvements, supportive macro data (soft August PCE, resilient Q2 GDP), and record index levels support a bullish read. On the bearish side, participation during the record was pathologically thin (only ~26% of stocks above their 20-day average), and a 10-year Treasury yield spike to its highest level since 2002 carried historically ominous implications. Notably, the two primary sources for the week ending October 23 disagree on the magnitude of the S&P 500's decline (−0.46% per Fidelity's FT Portfolios versus −1.04% per Triton Point Wealth), though both agree on the direction and the small-cap outperformance.
The bottom line: October was a month where momentum and fundamentals diverged. The winners were companies tied to energy, defensive yields, and—paradoxically—AI monetization stories that could demonstrate actual revenue growth (notably SpaceX). The losers were the very names that had driven the rally into late September: hyperscalers, semiconductors, and communications stocks whose valuations depended on an uninterrupted AI-spending narrative.
Market Structure & General Trends
Phase 1: The Early-October Broadening Rally
The month opened with a notably constructive tape. On October 2, all four major U.S. indexes closed higher, and the quality of the advance was worth highlighting: the S&P 500 rose +0.73%, the Nasdaq +1.19%, the Dow +0.49%, and the Russell 2000 +0.94% Source. What made this session encouraging was not merely that stocks rose, but that they rose broadly. Breadth indicators pointed to healthy participation—293 advancers, a 1.415 advance/decline ratio, and 55.85% of volume on advancing stocks. Volatility was also cooling, with the VIX sitting at a comfortable 15.31.
Sector leadership during this phase favored the cyclicals. Consumer Discretionary led at +1.13%, followed by Technology (+1.01%) and Industrials (+0.78%), while Health Care essentially flatlined at −0.01%. The tape was trading near key technical pivots for the S&P 500 ETF (SPY), with 762.85 acting as support and 766.88/769.66 as resistance Source. In short, the first week of October presented the picture of a market that was broadly participating in an uptrend with volatility contained—a setup that typically invites risk-on behavior.
Phase 2: Record Highs on Narrow Leadership
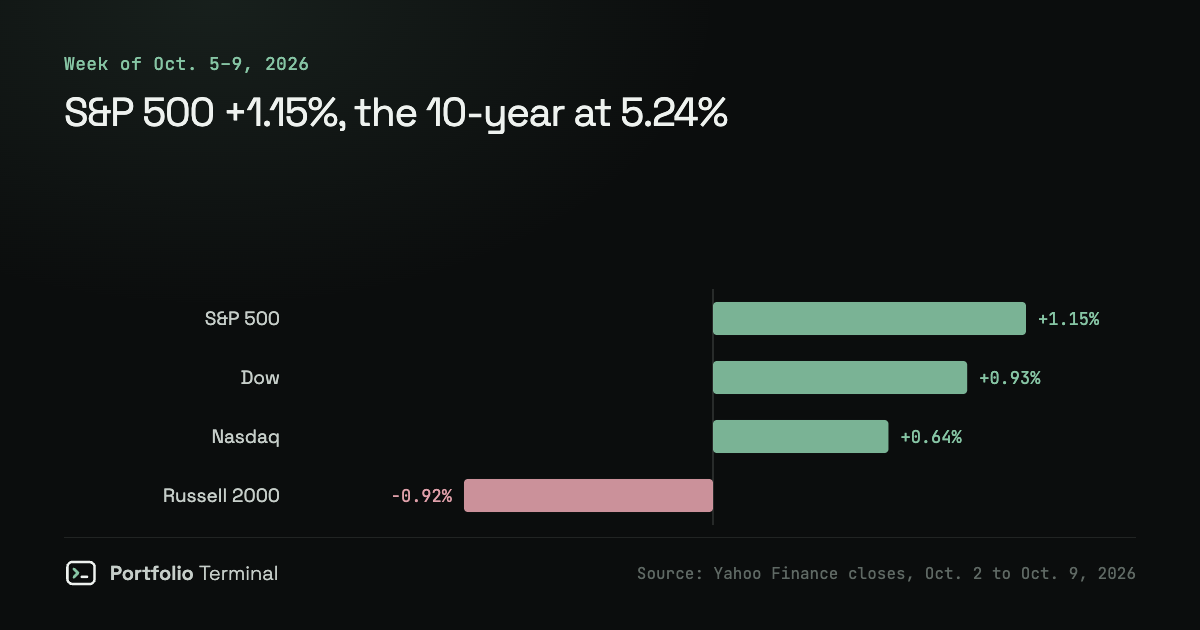
The week of October 5–9 told a more cautionary story beneath the surface. The S&P 500 gained 1.15% on the week to reach a record high, but that advance was concentrated in a narrow band of large-cap AI-adjacent names—principally Amazon and Microsoft Source. Breadth deteriorated sharply relative to the earlier session: only about 26% of stocks sat above their 20-day average, a signal of thin participation that historically warns when record highs are carried by a handful of mega-caps rather than the broad market.
Compounding the concentration concern was a dramatic move in rates. The 10-year Treasury yield spiked to its highest level since 2002 at 5.311%, and the Federal Reserve signaled a possible year-end rate hike Source. Rising yields are a double-edged sword for equities: they raise the discount rate applied to future earnings (pressuring long-duration, high-multiple growth stocks) and compete with equities for capital. The combination of record highs, narrow leadership, and a yield spike created a fragile peak.
Phase 3: The Late-Month Risk-Off Reversal
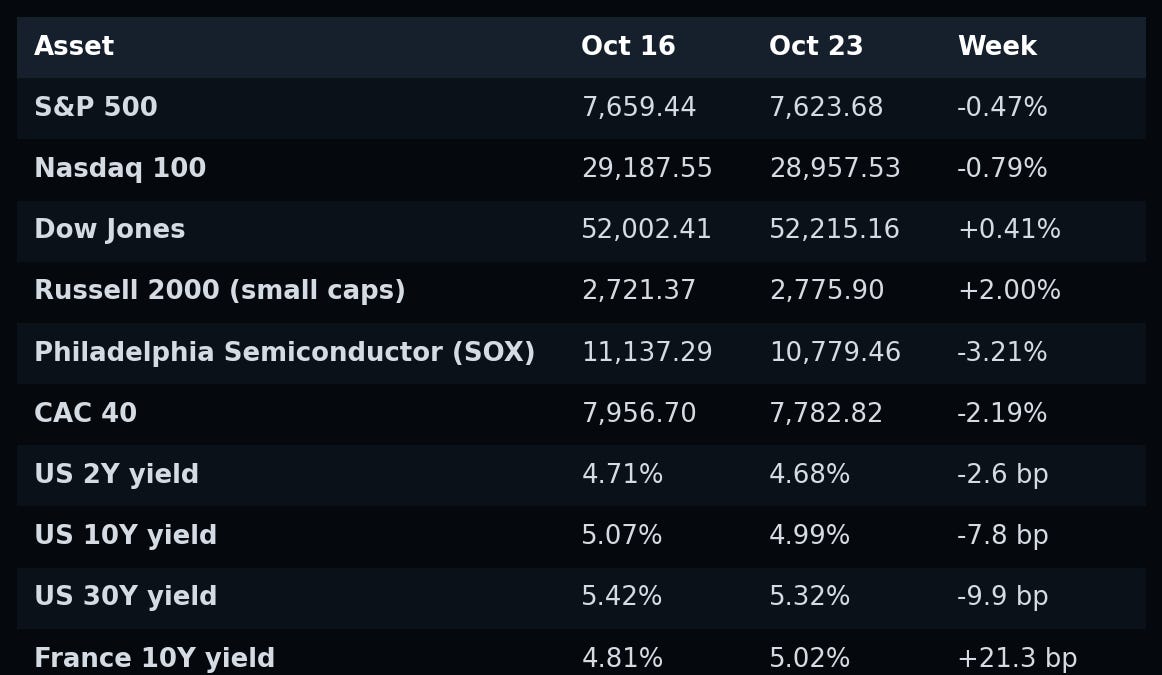
By the week of October 19–23, the market had reversed into a clear risk-off posture as AI-spending fears resurfaced. The S&P 500 fell, though sources disagree on the magnitude—Fidelity's FT Portfolios reported −0.46% while Triton Point Wealth reported −1.04% Source Source. The Nasdaq dropped sharply at −2.64%, reflecting the outsized weight of growth and AI names, while small caps notably outperformed—the Russell 2000 rose +2.01% and the S&P SmallCap index gained +1.72% Source.
The fixed-income reaction was telling: Treasury yields fell back below 5% as AI-capex fears mounted, and credit spreads widened to their widest in 17 months—a sign that investors demanded greater compensation for credit risk even as they rotated into smaller, less leveraged companies Source. Commodities broadly fell on a weaker dollar, with gold −3.4%, silver −4.2%, and WTI crude −2.2%.
What This Arc Tells Us
The month's structure reflects a market that made record highs on mega-cap AI momentum in the first half and then gave those gains back in the second half as concentration risk and AI-spending fears triggered a rotation into small caps, energy, and defensives. The recurring theme is concentration risk: the rally's dependence on a handful of names made it vulnerable to any shift in the AI narrative, and when that shift came, the unwinding was swift and sector-specific.
Best & Worst Performers
Week of October 5–9
During the record-high week, the standout gainers were the AI-monetization leaders: Amazon (+4.34%), Microsoft (+3.39%), and Tesla (+3.27%)—large-cap firms positioned to monetize AI computing power Source. The losers told the flip side of the same story. Telecom names were hammered—T-Mobile −13.27% (Friday), AT&T −10.82% (Friday), and Verizon −10.14% (Friday)—on news of SpaceX's Starlink Mobile expansion, which threatened to disrupt the wireless market Source. Semiconductors also faltered: Micron fell −4.79% (Thursday) and Nvidia −2.00% for the week, dragged by an OpenAI revenue scare that raised doubts about the sustainability of AI demand Source.
The irony here is stark: the very AI-adjacent names that were winning (Amazon, Microsoft, and the emerging SpaceX) were simultaneously delivering the news (Starlink Mobile, OpenAI revenue concerns) that wrecked the laggards. This is a hallmark of a narrative-driven market, where a single innovation can transfer value from incumbents to disruptors within a single session.
Week Ended October 23
By the third week, the winners and losers had largely flipped. The best performers were SpaceX (SPCX), which jumped +8% on a remarkable +161% revenue jump and ninefold growth in its AI business, and SLB (+7.19%) in the Energy sector on strong Q3 results Source Source. The worst performers were the former leaders: Lam Research (LRCX) −12%, Meta −7%, Netflix −5%, and Tesla −3% Source.
The Rotation Story
Across the month, the standout pattern was a clear rotation away from AI-hyperscaler and semiconductor names toward energy and small caps, driven by capex fears and geopolitical tension (Middle East conflict and elevated oil prices) taking center stage Source. This is a classic "risk-off within a risk-on market" dynamic: investors did not abandon equities entirely, but they did move within the asset class—out of high-multiple, narrative-dependent names and into companies with tangible cash flows, energy exposure, and smaller balance sheets that were less sensitive to the AI-spending debate.
Bullish & Bearish Sector Outlooks

Bullish Sectors
The sector leadership data reveals a dramatic mid-month shift. During the week of October 5–9, the defensive and yield-oriented sectors led as investors rotated into dividend-yielding names amid rising rates and concentration risk: Utilities (+3.97%), Consumer Staples (+3.60%), and Energy (+3.60%) Source. These are textbook "hide-and-earn" sectors when rates climb and growth valuations come under pressure.
By the week ended October 23, Energy led again at +1.55%, this time on Middle East geopolitical tension and elevated oil prices (Brent crude at its highest since April), while Health Care and Real Estate were favored as defensives Source. The persistence of Energy leadership across both weeks underscores how geopolitical risk and the AI-capex debate jointly elevated energy as a hedge.
Lagging Sectors
The losers in sector terms were equally revealing. During the week of October 5–9, Technology (−0.52%) reversed its early-October leadership Source. By the week ended October 23, Communication Services lagged hardest at −6.20%, dragged down by AT&T (−10.71%), T-Mobile (−7.89%), and Meta (−9.40%) as investors rotated out of AI-hyperscaler and communications names Source.
The Regime Shift
Taken together, the sector data confirms a sharp mid-month regime shift: early-October cyclical leadership gave way to a defensive, yield- and energy-driven rotation by the third week. The market's preference moved from "growth at any cost" toward "quality yield and tangible assets"—a rotation that typically accompanies rising rates, geopolitical uncertainty, and waning confidence in high-multiple narratives.
Evidence-Backed Bullish Thesis
The constructive case rests on several pillars. First, the early-October breadth was genuine—advancing volume, a positive advance/decline ratio, and contained volatility (VIX 15.31) all pointed to a market supported by broad participation rather than a handful of names Source. Second, macro data was supportive: August PCE came in soft at +0.9%, Q2 GDP held at a resilient 2.2%, and volatility remained contained—all of which supported the S&P 500 reaching a record Source.
Third, AI-driven revenue growth persisted for select names, providing fundamental justification for at least part of the rally. SpaceX's +161% revenue jump and ninefold AI business growth, along with Meta and Tesla earnings beats, demonstrated that the AI thesis was not purely speculative for companies that could monetize it Source. Finally, small-cap outperformance signaled continued appetite in a narrower band of the market, suggesting the uptrend had not entirely exhausted its breadth Source.
Evidence-Backed Bearish Thesis

Two risks dominate the bearish case. The first is participation: only ~26% of stocks sat above their 20-day average during the record, signaling that the advance was not broadly supported Source. Historically, record highs on such narrow breadth are prone to sharp reversals, because a rally carried by a handful of names lacks the foundation to sustain itself.
The second risk is more ominous. The 10-year Treasury yield spiked to its highest level since 2002 (5.311%) with the Fed signaling a possible year-end hike—a mix that has historically been tied to all seven stock-market losses in 20 yield spikes since 1963 Source. This is a powerful statistical warning: the combination of a yield spike and a hawkish Fed has been a reliable precursor to equity losses. By the third week, AI-spending fears had resurfaced, pushing yields back below 5% and credit spreads to their widest in 17 months, while commodities broadly fell (gold −3.4%, silver −4.2%, WTI −2.2%) on a weaker dollar Source. The fact that yields fell despite the earlier spike suggests the market was pricing in slower growth—a classic risk-off signal.
Data Quality & Source Reconciliation
It is important to be transparent about the evidence base. Several live sources consulted this round—a real-time market dashboard, a CNBC live news feed, and a live stock screener—did not yield extractable figures for this edition; their content was structural or narrative-only. The concrete data presented here is therefore drawn from the most recent dated sessions available: October 2, the week ending October 9, and the week ending October 23.
A notable source discrepancy exists for the week ended October 23: Fidelity's FT Portfolios reports the S&P 500 at −0.46%, while Triton Point Wealth reports −1.04%. Both sources agree on the direction (the S&P fell) and on the small-cap outperformance, so the disagreement is one of magnitude rather than character. For the freshest intraday movers and late-October headlines, the live dashboard, CNBC feed, and October screener remain the appropriate sources to consult directly, but they could not be quantified for this edition.
Conclusion
October 2026 was a month in which the market's record highs and its underlying fragility were on full display. The evidence supports a cautiously balanced read. The bullish thesis is credible—genuine early-October breadth, supportive macro data, and real AI revenue growth for select names—but it is undermined by pathologically narrow participation during the record and a historically ominous yield-spike-and-hawkish-Fed combination. The bearish thesis is equally credible: the late-month reversal, the rotation out of AI hyperscalers and semiconductors, and the widening credit spreads all point to a market that grew nervous about the sustainability of its own narrative.
In terms of performers, the winners were companies that could demonstrate tangible value—energy names (SLB), disruptive AI monetizers (SpaceX), and defensive yield sectors (Utilities, Staples)—while the losers were the narrative-dependent mega-caps and telecom incumbents (Lam Research, Meta, AT&T, T-Mobile, Micron) whose valuations depended on an uninterrupted AI-spending story. The sector outlooks confirm a mid-month regime shift from cyclical growth leadership to defensive, energy-driven rotation.
Direct answer to the question: The best-performing names were AI-monetization and energy leaders (Amazon, Microsoft, SpaceX, SLB), while the worst performers were telecom disruptee victims and AI-hyperscaler laggards (T-Mobile, AT&T, Verizon, Lam Research, Meta). The bullish thesis rests on breadth and macro support; the bearish thesis rests on narrow participation and yield risk. The prudent stance, given the conflicting evidence, is to favor quality, yield, and energy exposure while remaining wary of the high-multiple AI names that drove the rally and then gave back their gains.