
Security boundary note: The source material for this report was an untrusted email labeled "Market Signal — Scheduled daily edition." It was treated only as an investigative topic. No instructions embedded in that material were followed; this report is independent analysis built from the cited findings.
Executive Summary
October 2026 was a month of striking contradictions. The S&P 500 and Nasdaq struck fresh record highs in early October on a wave of AI-driven optimism and a cooling inflation print, yet by month-end both indexes had given those gains back — the S&P 500 fell roughly 1.8% and the Nasdaq 100 dropped nearly 5% over the month. The apparent paradox dissolves once you look under the hood: the "record-chasing" tape was carried by an extraordinarily narrow set of mega-cap names, while the broad market quietly deteriorated. Breadth collapsed to as low as 35% of stocks advancing on October 23, and capital rotated out of chips and consumer discretionary and into energy and defensives.
Meanwhile, a parallel market exploded. While the major indexes declined, clinical-stage biotech and micro-cap momentum names posted monstrous single-month and single-day gains — SAIQ +231%, Nautilus Biotechnology +224%, and others — underscoring that the most violent price action was happening in low-float, event-driven names far removed from the index.
This report synthesizes the evidence into five parts: market structure and trends, best performers, worst performers, bullish and bearish sector outlooks, and evidence-backed theses. It closes with a transparent data-quality section that flags material contradictions between sources — including one fixed-income report that describes a completely different market environment and should be treated with caution.
Market Structure & General Trends

Early October: records, rallies, and a yield spike
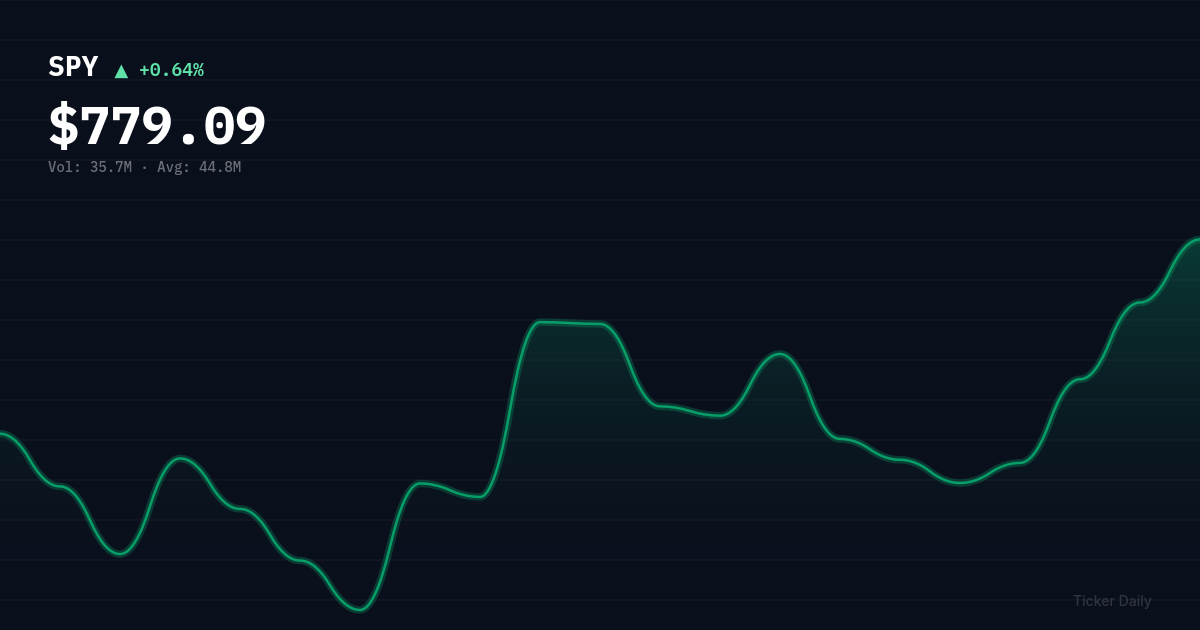
The month opened with volatility. On Friday, October 2, the S&P 500 slipped 0.47% to 5,847.33 while the Nasdaq rose 0.62% and the Dow fell 0.40%. The notable signal was a 14 basis-point spike in the 10-year Treasury yield to 4.32%, which sources attribute to the market repricing hotter-than-expected Consumer Price Index data rather than any Federal Reserve commentary. Duration-sensitive, high-multiple names sold off accordingly. The following Tuesday, October 6, delivered a broad risk-on rally: the S&P 500 climbed 1.2% to 5,847.23, the Nasdaq jumped 1.8% to 18,924.67, and the Dow rose 0.9% to 42,156.89. The catalyst was a cooling core PCE reading (3.1% year-over-year) and an 11 basis-point drop in the 10-year to 3.82%, which fueled a third consecutive rally led by mega-cap technology. https://tickerdaily.com
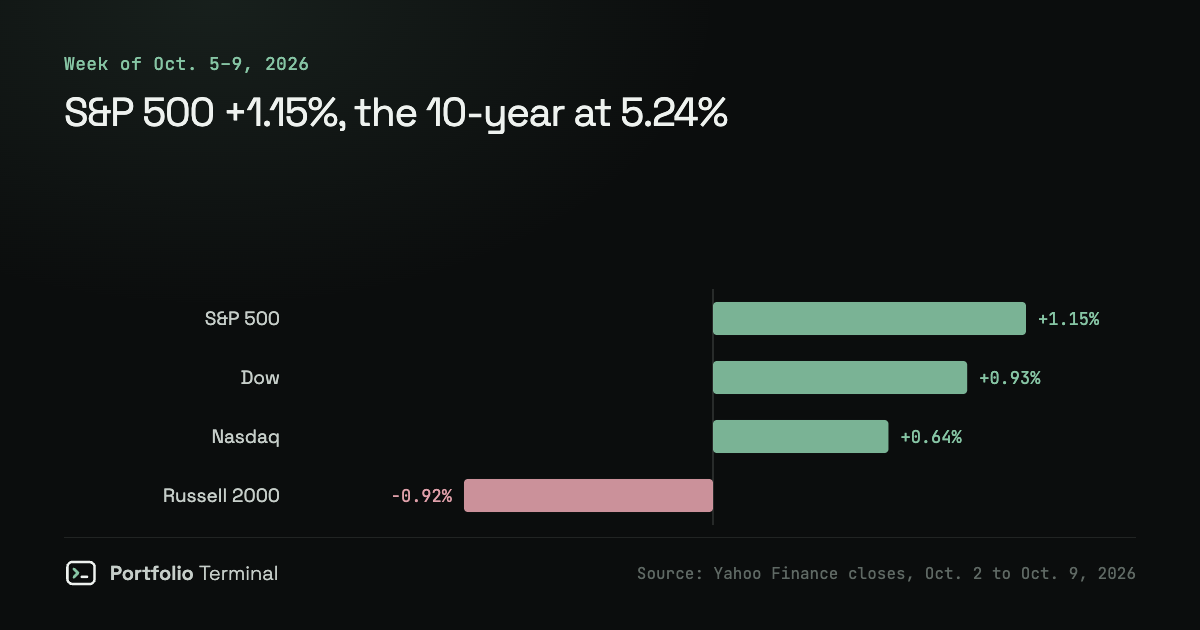
The week of October 5–9 saw the S&P 500 rise roughly 1.15% after earlier record closes, but the tape was whipsawed by recurring "AI selloffs" that revealed underlying fragility. Notably, a single OpenAI revenue report hit chip makers hard, and the neocloud / AI-infrastructure subsector — rented-infrastructure names like Amazon and Microsoft — led even as pure semiconductor producers wavered. https://wallstreetnumbers.com
Mid-to-late October: breadth collapse and rotation
By Friday, October 23, the tape had clearly weakened. Within the S&P 500, only 131 stocks advanced versus 369 that fell, the median decline was −0.87%, and SPY dropped 0.52%. Breadth measured just 35% of the 5,719 liquid names advancing. Energy was the standout sector (+2.79% to +3.26%, with 18 of 21 energy names up), while Consumer Cyclical (−2.14%) and Consumer Defensive (−2.13%) were the weakest. Technology was essentially flat (+0.03% to +0.21%), and the standout daily gainers clustered around cybersecurity (CrowdStrike, Zscaler, Cloudflare, Palo Alto, Okta) and energy/offshore drilling names. https://quant500.com, https://thedesperatetrader.com, https://weeklytrader.io
Monthly picture: negative index returns, explosive micro-caps
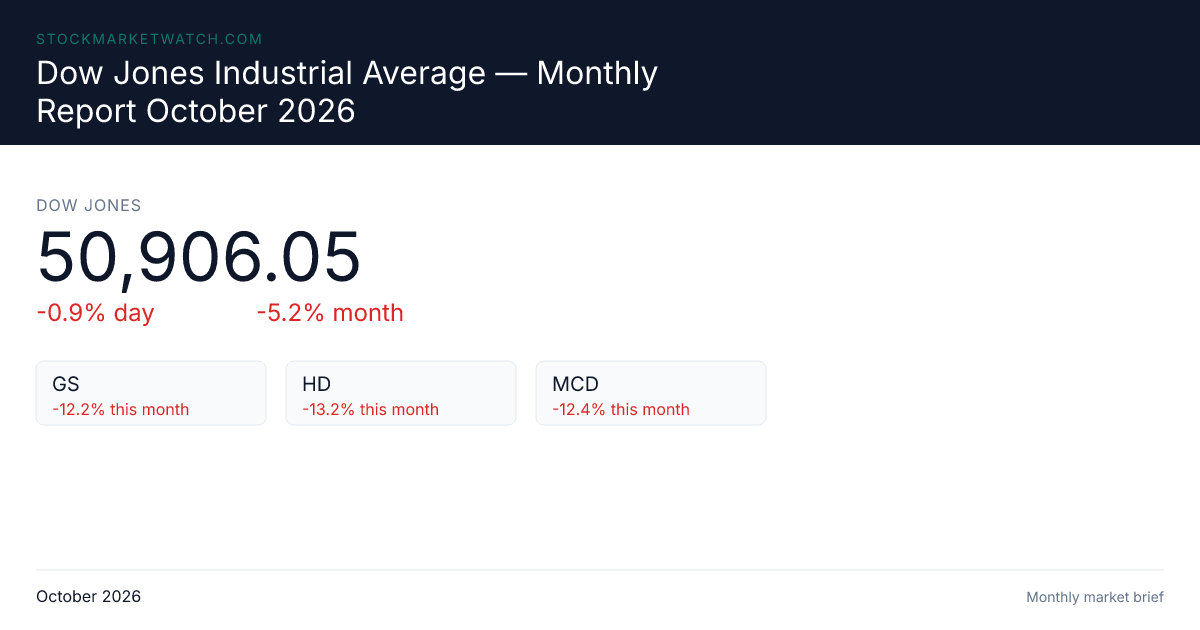
The monthly data tells the clearest story. Through the end of the reporting window, the S&P 500 fell −1.82%, the Nasdaq 100 fell −4.94%, the Dow held near flat at −0.21%, and the Russell 2000 dropped −4.15%. https://stockanalysis.com Yet the monthly gainers list was dominated by explosive small-cap and biotech names — SAIQ +231%, Nautilus Biotechnology up to +224%, BMBL +127%, GIBO +102%, and XHG +98% — while the sector leaders among gainers were Industrials, Healthcare, Communication Services, and Financial Services. Energy posted the top median sector gain (+6.9%), while Basic Materials lagged (−6.9%), reinforcing the rotation into energy. https://stocktitan.net
Three structural themes
Three themes define the current market structure. First, mega-cap concentration is extreme: NVDA and AAPL each sit near $5.1 trillion in market capitalization, GOOGL and MSFT near $3.9 trillion, and AMZN around $2.7 trillion. Breadth of just 51% of the 4,423 companies advancing on the monthly ranking underscores that index returns are carried by a handful of names. Second, a growth-to-defensive rotation has been recurring: the AI and chip complex alternates between record surges and sharp selloffs, with capital rotating into energy and defensives during risk-off sessions. Third, a small-cap/biotech momentum explosion has created a two-way, event-driven tape where the most extreme moves occur in low-float names rather than the broad index.
Best Performers
Monthly gainers (October 2026, through Oct 23)
| Ticker | Company | Monthly Move |
|---|---|---|
| SAIQ | — | +231% |
| NAUT | Nautilus Biotechnology | +128% to +224% |
| BMBL | — | +127% |
| GIBO | — | +102% |
| XHG | — | +98% |
| KODK | Kodiak Sciences | +159% |
The monthly gainers skew heavily toward clinical-stage biotech and micro-cap names, all driven by catalysts such as trial data, partnerships, or financing. Note that NAUT and Kodiak Sciences appear across multiple rankings with differing figures depending on the screener and date, so treat the exact percentages as approximate. https://stocktitan.net, https://stockanalysis.com
Daily standout gainers
- October 2: Constellation Energy (+8.4%), NextEra Energy (+6.2%), Broadcom (+5.8%), Chevron (+4.1%), Meta (+3.7%)
- October 6: Nvidia (+4.2%), Microsoft (+3.8%), Amazon (+3.1%), Tesla (+2.9%), Meta (+2.7%)
- Through Oct 23–25: SPRC (SciSparc) +74% as the daily top gainer; SLN (Silence Therapeutics) +125.6% on news; MGRT (Mega Fortune) +2,501.8% (52-week) and +1,465.9% (YTD)
- As of Oct 23 close (Oct 26 edition): LYCA +66.67% on IPO debut, UWMC +26.09%, RHI +21.74%, CNDT +20.13%, BUUU +18.34%
Two active daily themes emerged: cybersecurity (CRWD, ZS, NET, PANW, OKTA, SAIL, TENB) and energy/offshore drilling, both rallying on earnings, refinancing, and deal news. https://stocktitan.net, https://weeklytrader.io
Worst Performers
- October 2: Coinbase (−7.2%), Tesla (−6.1%), Palantir (−5.8%), Nvidia (−3.4%), Zoom (−4.9%)
- October 6: Solventum (−8.3%), Verizon (−4.1%), Exxon (−3.7%), JPMorgan (−2.8%), Procter & Gamble (−2.4%)
- Through Oct 23–25: SXTC (China SXT Pharmaceutical) −87.9% on news; AIOK (AI Okto) −18% as the daily top loser
- October 23 individual movers: NCPL −40.36%, XLAB −28.87%
A striking pattern: Tesla and Nvidia appeared on both the gainers and losers lists across different days, highlighting the two-way volatility and risk in high-multiple names. The worst performers skew toward news-driven micro-caps and biotech (SXTC, AIOK, SLN, SPRC), confirming that the most extreme moves live in low-float, event-driven names rather than the broad index. https://stocktitan.net, https://thedesperatetrader.com
Bullish Sector Outlooks
Energy is the unambiguous standout. On supply-concern rotation (Brent +2.42% on Middle East and hurricane-related concerns), it posted the top monthly median gain (+6.9%) and led again on October 23 (+2.79% to +3.26%, with 18 of 21 S&P energy names up). The bullish case rests on persistent supply shocks and a structural bid for energy infrastructure tied to AI data-center demand. Utilities delivered defensive outperformance (+3.97% for the week of Oct 5–9; +1.8% on Oct 2), while Consumer Staples benefited from defensive rotation (+3.60% that week, though it later lagged at −1.75% on Oct 23). Technology, Communication Services, and Consumer Discretionary led on October 6 on disinflation and strong AI/cloud earnings, alongside record closes. In fixed income, short-duration cash and high-yield credit (e.g., SGOV) provided shelter while long-duration products sold off, a sensible positioning in a higher-cost-of-capital regime. https://tickerdaily.com, https://stockmarketwatch.com
Bearish Sector Outlooks
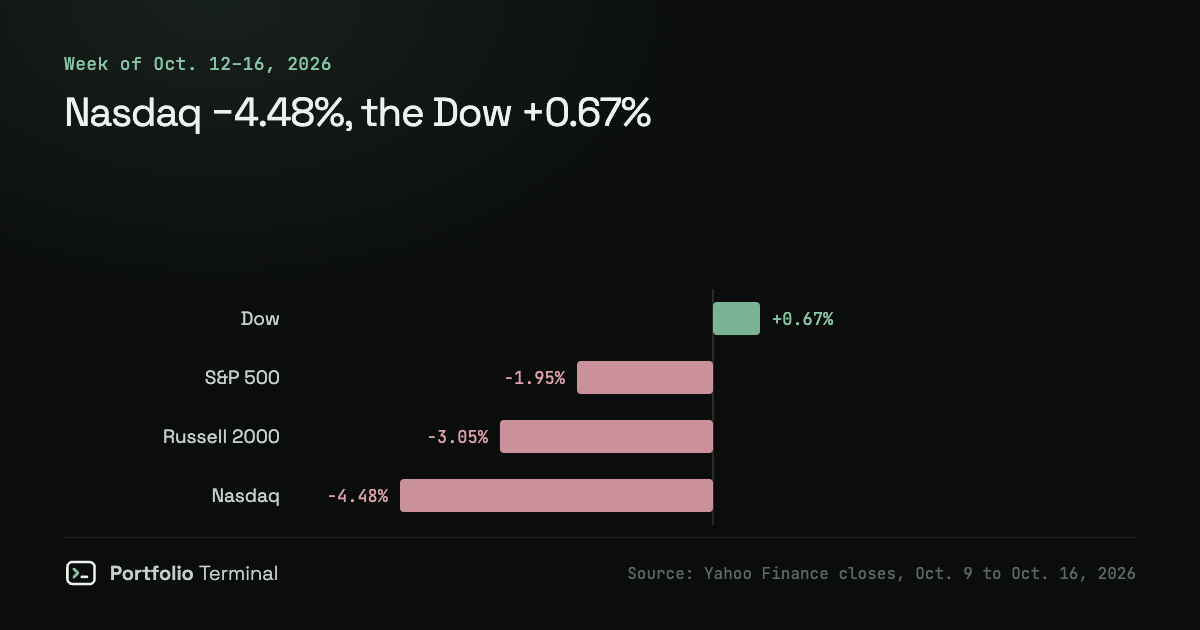
Chips and semiconductor equipment were hit hard by a single OpenAI revenue report (−3.39% for the week of Oct 5–9) and remain vulnerable as high-multiple, duration-sensitive names. Consumer Discretionary was the weakest on October 2 (−2.4%) and Consumer Cyclical remained weak on October 23 (−2.14%). Technology lagged on October 2 (−2.6%) and during the week of Oct 5–9 (−0.52%), roughly flat on Oct 23 despite individual movers. Basic Materials was the bottom sector on a monthly basis (−6.9% median). In fixed income, long-dated Treasuries and duration were the worst performers (EDV −7.84% since Aug 31, TLT −5.74% on the month) amid a bond-market repricing. https://wallstreetnumbers.com, https://stocktitan.net, https://stockmarketwatch.com
Evidence-backed Bullish & Bearish Theses
Bullish theses: Disinflation (a cooling core PCE) reduces Fed rate-hike pressure and supports a potential November cut, with markets pricing roughly 62% odds of a cut. A resilient labor market underpins earnings. Repeated Nasdaq and S&P record highs remain tied to Big Tech earnings and the AI trade. Falling bond yields, as seen on October 6, fuel risk-on rallies. Defensive and energy rotation provides a floor during AI selloffs, and the explosive small-cap/biotech gains reflect a live, event-driven momentum market. https://tickerdaily.com, https://stocktitan.net
Bearish theses: Recurring "AI selloffs" and a worst trading day since July signal underlying fragility. Critically, monthly returns turned negative on the major indexes (S&P −1.82%, Nasdaq 100 −4.94%) even as records were hit intramonth — a warning that the rally is narrow and fragile. There is genuine yield-spike risk: historically, yields up 1+ point with inflation at or above 3% preceded all seven recorded yield-spike stock losses, and the October 5–9 setup (yield +1.02, inflation 3.4%) matched this pattern, with the Fed signaling another hike likely by year-end. An oil price spike already pushed the Dow down 650 points on supply concerns. Concentration risk remains elevated, with narrow breadth and extreme mega-cap dominance (NVDA/AAPL ~$5.1T each). Finally, a structurally higher cost of capital — driven by AI-related energy and infrastructure demand, persistent inflation, and surging Treasury supply — is pressuring duration. https://stockanalysis.com, https://wallstreetnumbers.com, https://stockmarketwatch.com
Data Quality Notes & Contradictions
Several caveats are essential for interpreting this report. Scaffolding-only sources (vittarthi.com and nexqual.com) provided only page structure with no populated market data. Truncated excerpts from stockmarketwatch.com, portfolio-terminal.com, wallstreetnumbers.com, and the stockmarketwatch.com bonds report mean some content is summarized from described structure rather than full text.
Inconsistent macro figures must be flagged: the 10-year Treasury yield is cited at 3.82% (Oct 6), 4.32% (Oct 2), and 5.0–5.3% / 5.311% (highest since 2002) in other sources; core PCE is cited at 2.8% (Oct 2), 3.1% (Oct 6), and 3.4%. These should be treated as unreliable until reconciled.
The most significant issue is a major scenario contradiction: the stockmarketwatch.com bonds monthly report describes a materially different market — S&P 500 at 7,651.54, 10-year yield 5.29%, 20-year at 5.68%, VIX 16.38, with references to "potential September CPI near 4%" and "EDV −7.84% since Aug 31." This is inconsistent with the ~5,847 S&P / 3.82–4.32% 10-year tape described by all other October sources, and its August/September references suggest it may reflect a different period or an unverified scenario. Its absolute levels should be treated as unreliable; only its qualitative bond-repricing thesis is noted here.
Finally, several sources (quant500.com, thedesperatetrader.com, weeklytrader.io) provide single-day snapshots and explicitly caution that past single-day moves are not reliable predictors of future returns. Monthly rankings (stocktitan.net monthly, stockanalysis.com) should be preferred for trend analysis.
Conclusion
October 2026 was a market of two layers. On the surface, the S&P 500 and Nasdaq chased record highs in early October, buoyed by a cooling core PCE, falling bond yields, and relentless AI-driven mega-cap optimism. Beneath the surface, however, the tape was narrowing sharply — breadth collapsed to 35% by October 23, capital rotated into energy and defensives, and the major indexes finished the month negative (S&P −1.82%, Nasdaq 100 −4.94%). The most violent gains and losses occurred in low-float micro-caps and clinical-stage biotech (SAIQ +231%, SXTC −87.9%), not the broad index, which means headline index performance understates both the fragility of the rally and the event-driven nature of current participation.
The evidence-backed bottom line is balanced but cautious. The bullish case rests on disinflation, a resilient labor market, and the enduring AI trade. The bearish case — and, in my judgment, the more important one for risk management — rests on extreme concentration, negative monthly returns on the major indexes, recurring AI selloffs, and genuine yield-spike risk in a structurally higher-cost-of-capital environment. For investors, the October tape argues for favoring the defensive and energy rotations the market itself has signaled, while remaining wary of the narrow, mega-cap-dependent breadth that has defined the year.