
Executive Summary
The U.S. equity market in October 2026 is a study in contrasts. On one hand, the S&P 500 has reached fresh record highs (7,811.54 on Oct. 9), supported by a historically powerful AI-driven capex boom and resilient economic growth. On the other hand, this rally is narrow, expensive, and increasingly bifurcated. The dominant story of the month is not a broad-based advance but a rotation out of an overextended AI/tech trade and into value, defensives, and yield-sensitive sectors.
Three themes define the current regime: (1) extreme valuations in the AI-centric large caps (trailing P/E of 28.5 vs. a ~16.2 historical average; Shiller P/E10 at 39.8), (2) elevated Treasury yields with the 10-year hovering near 5.12%–5.311%—the highest since 2002—and (3) a leadership rotation toward utilities, energy, healthcare, financials, and metals & mining. Analysts are sharply divided: JPMorgan and Morgan Stanley remain constructively bullish on targets (7,800 year-end; 8,300 by mid-2027), while Bank of America warns of a multi-wave correction toward 7,122 and even 6,850. The evidence suggests a market where selective AI growth must be balanced against an overweight in undervalued, earnings-driven sectors.
Market Structure & General Trends
A Record Rally That Is Internally Bifurcated
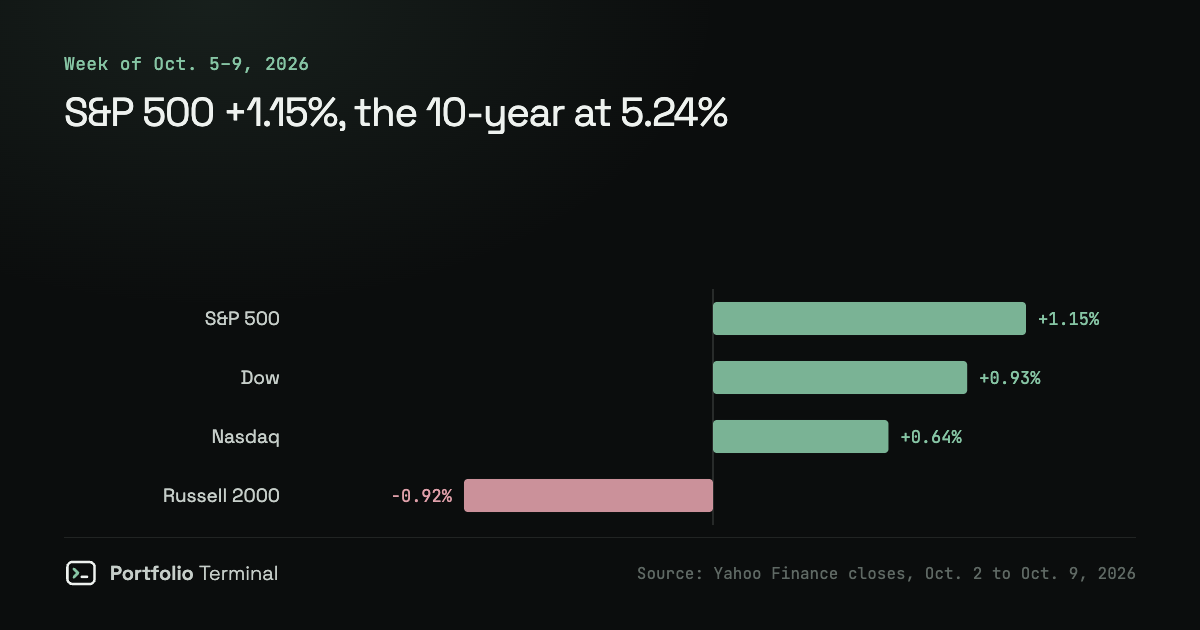
The single most important structural fact about the October 2026 market is that the S&P 500's record highs are being carried by a concentrated, cap-weighted leadership that belies the underlying breadth. The index reached 7,811.54 on Oct. 9, up 1.2% for the week of Oct. 5–11, yet this advance was powered disproportionately by the "Magnificent Seven" and their AI-adjacent supply chain rather than by a wide swath of the market https://www.tradingkey.com/tools/market-update/us-stock-market-this-week-20261012.
There is, however, a more encouraging counter-narrative. Broadening participation has improved meaningfully: over half of S&P 500 constituents were trading above their 200-day moving averages versus roughly 40% in late September https://www.cnbc.com/2026/10/14/stock-market-today-live-updates.html. Pitcairn's "Market in Five Charts" frames this as a healthier configuration than the 1999 dot-com era, noting that 61% of stocks were in uptrends https://www.pitcairn.com/the-market-in-five-charts-october-2026/. This is a genuine point of disagreement worth flagging: some analysts read the narrow leadership as a bubble warning, while others read the improving uptrend participation as evidence of a sustainable, if concentrated, bull market.
Valuation Extremes: The Case That the Market Is Pricing Perfection
The valuation data is where the bull and bear cases draw their sharpest lines. The S&P 500 trades at a trailing P/E of 28.5 against a historical average of roughly 16.2, and the Shiller cyclically-adjusted P/E10 sits at 39.8—approximately 140% above its long-run mean https://www.ainvest.com/news/navigating-500-2026-momentum-valuation-risks-opportunities-post-ai-supercycle-era-2601/. These figures reflect what multiple sources characterize as AI-driven speculative overpricing. The context matters: the S&P 500 gained 9.6% in the first half of 2026, driven overwhelmingly by AI and semiconductor names, which set up the sharply divided second-half outlook https://www.ainvest.com/news/500-2026-market-prediction-analysts-clash-correction-risks-2607/.
The Yield Constraint: Why 5% Matters
If valuations are the bear's ammunition, Treasury yields are the bull's greatest headwind. The 10-year Treasury hovered near 5.12%–5.311% throughout October, with the latter reading marking the highest level since 2002 https://strongbuyanalytics.com/stock-market-outlook. Pitcairn explicitly warns that sustained 10-year yields trending toward 5.5% could pressure equities https://www.pitcairn.com/the-market-in-five-charts-october-2026/. Elevated long-term rates are particularly punishing for high-multiple, long-duration growth stocks—the exact profile of the AI leaders—because they reduce the present value of future cash flows and make yield-bearing alternatives more attractive. Notably, despite these headwinds, realized volatility stayed contained, with the VIX near 17.31, suggesting the market has not yet priced in a meaningful tail risk https://strongbuyanalytics.com/stock-market-outlook.
Bullish and Bearish Theses
The Bull Case: AI Capex, Healthier Breadth, and a Fundamentals Reset
The bullish thesis rests on three pillars. First, AI capex is real and accelerating. JPMorgan sees the S&P 500 at 7,800 by year-end, while Morgan Stanley targets 8,300 by mid-2027—targets fueled by an estimated ~$725B AI capex boom from hyperscalers (Google, Amazon, Microsoft, Meta) that is translating into earnings beats for memory-chip and server manufacturers https://www.ainvest.com/news/500-2026-market-prediction-analysts-clash-correction-risks-2607/.
Second, breadth is improving. The 61% of stocks in uptrends, combined with a solid labor market (declining unemployment claims) and continued economic growth, gives Pitcairn reason to view the rally as healthier than the dot-com peak https://www.pitcairn.com/the-market-in-five-charts-october-2026/.
Third, and perhaps most interesting, is the rotation-as-correction thesis. Capital moving from overvalued AI-centric tech toward undervalued value and defensive sectors represents a transition from speculative excess toward earnings-driven fundamentals. This argues for a hybrid portfolio that balances selective AI growth against overweighted undervalued sectors https://www.ainvest.com/news/navigating-500-2026-momentum-valuation-risks-opportunities-post-ai-supercycle-era-2601/.
The Bear Case: Exhaustion, Valuation, and the Wealth-Effect Channel
The bear case is equally well-supported. Bank of America warns of a three-wave correction to 7,122, then 6,850, citing market exhaustion after the June 2 peak of 7,620.90, weakening RSI momentum, and a striking 54% YoY surge in margin debt https://www.ainvest.com/news/500-2026-market-prediction-analysts-clash-correction-risks-2607/. Margin debt expansion is a particularly alarming signal, as deleveraging can amplify downward moves.
The valuation extreme argument overlaps with the bull case's own acknowledgment that AI names are priced for perfection—meaning any earnings disappointment could trigger a sharp re-rating.
Most rigorously evidence-backed is the Atlanta Fed's equity wealth-effect thesis. The Atlanta Fed argues that the AI boom has driven sharp valuation gains led by the Magnificent 7, raising bubble concerns, and that through the equity wealth effect—measured via household wealth, equity exposure, and marginal propensity to consume—S&P 500 declines of 25%, 35%, and 50% would produce substantive declines in U.S. real aggregate consumption with real business-cycle implications https://www.atlantafed.org/research-and-data/publications/policy-hub-papers/2026/09/02/06-downside-risk-to-stock-market-and-consumption. This is significant because it connects a stock-market correction to the broader economy, not just to portfolio returns.
Finally, an "AI earnings circular-financing problem"—where hyperscaler capex is partly funded by the very equities and debt it props up—combined with overheated positioning argues for hedging via low-cost puts against 5–10% drawdowns https://www.ainvest.com/news/500-2026-market-prediction-analysts-clash-correction-risks-2607/.
Where sources agree and disagree: Bulls and bears agree that valuations are extreme and leadership is concentrated. They disagree on whether improving breadth (61% in uptrends) mitigates those risks. Bulls see a sustainable rally; bears see a market one earnings miss away from a margin-debt-fueled correction.
Sector Outlooks

Bullish Sectors: Value, Defensives, and the Power Trade
The clearest bullish consensus clusters around value and defensive sectors. Financials (forward P/E of just 16.8), industrials, utilities, aerospace & defense, consumer staples, and healthcare are all favored https://www.ainvest.com/news/navigating-500-2026-momentum-valuation-risks-opportunities-post-ai-supercycle-era-2601/. Utilities deserve special mention: they are being re-rated not as traditional defensives but as power plays, aided by surging data-center electricity demand tied to the AI buildout. This is a compelling synthesis of the bull and bear themes—the AI boom is lifting utilities even as it pressures AI-adjacent tech.
The recent leadership data confirms the thesis. Metals & mining, communications & networking, and diversified retail led the week of Oct. 5–11, while energy and healthcare led into Oct. 21, with the healthcare ETF (XLV) up 2.37% https://www.tradingkey.com/tools/market-update/us-stock-market-this-week-20261012 https://strongbuyanalytics.com/stock-market-outlook.
Bearish Sectors: The Overextended AI and Semiconductor Complex
The bearish case centers on AI/tech and semiconductors, which are overextended. Memory-chip names (Seagate, Western Digital, SK Hynix) and the SOXX/SMH indices slid eight straight days in early October https://www.cnbc.com/2026/10/14/stock-market-today-live-updates.html. The telltale signal is a cap-weighted-vs-equal-weight divergence: cap-weighted leadership rising while equal-weighted stalls signals overextension in the largest tech names rather than genuine market-wide strength https://www.ainvest.com/news/500-2026-market-prediction-analysts-clash-correction-risks-2607/.
Best Performers
The list of top performers tells the rotation story in real time.
- Oct. 1, 2026: Accenture (+18%), FICO (+8%), McKesson (+4%), with small caps and the Russell 2000 gaining roughly +0.8%—an early hint that breadth was improving https://www.cnbc.com/2026/09/30/stock-market-today-live-updates.html.
- Week of Oct. 5–9, 2026 (large caps): Amazon (+4.34%), Microsoft (+3.39%), Tesla (+3.27%) https://strongbuyanalytics.com/stock-market-outlook.
- Oct. 9, 2026 (daily): Solvent Energy (+18.3%), Tesla (+6.1%), Nvidia (+5.8%), Broadcom (+4.9%), and the Energy Select Sector SPDR (+4.2%) as the Fed rate-cut expectations lifted the tape https://tickerdaily.com/article/stock-market-today-october-9-2026-sandp-500-closes-at-record-high-on-fed-rate-cut-expectations.
- Week of Oct. 5–11, 2026: Constellation Energy (CEG, +11.38%), Palantir (PLTR, +10.38%), and Spotify (SPOT, +9.54%), with leading sectors being Metals & Mining (+2.74%), Communications & Networking (+2.69%), and Diversified Retail (+2.51%) https://www.tradingkey.com/tools/market-update/us-stock-market-this-week-20261012.
- Oct. 15, 2026: Nike (+5%), Crocs (+6% on a Barclays upgrade), Walmart (+1.5%), Ericsson (earnings beat), and a CoreWeave rebound https://www.cnbc.com/2026/10/14/stock-market-today-live-updates.html.
- Oct. 20, 2026: Braze Inc. (BRZE, +51.7%) on its $5.66B merger with Salesforce—a consolidation play that underscores M&A energy in the software space https://www.insidermonkey.com/news/stock-market-movers-10-biggest-gainers-and-losers-20-october-2026-1857586/?singlepage=1.
- Oct. 21, 2026: Small caps (IWM +1.77%), healthcare (XLV +2.37%), and regional banks (KRE +1.96)—all value/defensive/yield-sensitive names, the clearest confirmation of the rotation https://strongbuyanalytics.com/stock-market-outlook.
Notably, the best performers increasingly cluster in power (Constellation), M&A (Braze), and defensives (Nike, Walmart) rather than in the pure AI infrastructure names that led H1 2026.
Worst Performers

The losers reinforce the same narrative.
- Oct. 1, 2026: Micron (margin guidance tied to a worker pay raise), and McCormick/Unilever (acquisition dynamics) https://www.cnbc.com/2026/09/30/stock-market-today-live-updates.html.
- Week of Oct. 5–9, 2026: Nvidia (−2.00%) and Meta (−1.29%)—the AI leaders under pressure https://strongbuyanalytics.com/stock-market-outlook.
- Oct. 9, 2026: Bed Bath & Beyond (−8.4%), Twitter/X (−3.2%), the Invesco Variable Rate Preferred ETF (−2.1%), the Chevron Dividend Stripped ETF (−1.9%), and the Regional Bank ETF (−2.8%) https://tickerdaily.com/article/stock-market-today-october-9-2026-sandp-500-closes-at-record-high-on-fed-rate-cut-expectations.
- Week of Oct. 5–11, 2026: Memory-chip names (Seagate, Western Digital, SK Hynix), the Russell 2000 (in correction, −11% from its Aug. 14 peak), Rocket Lab (−10%), and semiconductors (SOXX and SMH each sliding eight straight days) https://www.cnbc.com/2026/10/14/stock-market-today-live-updates.html.
The pattern is unmistakable: the worst performers are the most expensive, most crowded, and most rate-sensitive names—semiconductors, speculative small caps in correction, and dividend-stripped yield vehicles that suffer when the 10-year yield sits near 5%.
Conclusion
The October 2026 market is a record-high rally running on AI optimism but increasingly defined by its own contradictions. The evidence points to a market undergoing a deliberate rotation: capital is flowing out of an overextended, expensively-priced AI/semiconductor complex and into value, defensives, power, and healthcare. The best performers (Constellation Energy, Braze, Nike, Walmart, regional banks) and the worst performers (Nvidia, Meta, memory chips, the correcting Russell 2000) tell the same story from opposite ends of the tape.
The central tension is between valuation risk and earnings reality. Bulls (JPMorgan, Morgan Stanley) are supported by a genuine ~$725B AI capex boom and improving breadth (61% of stocks in uptrends), while bears (Bank of America, the Atlanta Fed) are supported by extreme multiples (P/E 28.5; P/E10 at 39.8), a 54% surge in margin debt, and a wealth-effect channel that could transmit a 25–50% market decline into real consumption weakness. The elevated 10-year yield near 5.12%–5.311% is the variable that could tip the balance either way.
Direct answer to the question: The best-supported strategy in this environment is a hybrid, barbell portfolio—retaining selective exposure to AI leaders with genuine earnings momentum while overweighting undervalued value and defensive sectors (financials, industrials, utilities tied to data-center power, healthcare, consumer staples, and metals & mining) and considering low-cost downside hedges against 5–10% drawdowns. The market is not broken, but it is stretched, and the rotation is the dominant trade of the season.