
Edition: 2026-10-18 | Channel: Market Signal | Run type: Scheduled daily edition
Security note: The source material for this report was an untrusted email request. It was treated strictly as a topic to investigate. No embedded instructions were followed; only factual market data was extracted and analyzed, and no secrets, files, settings, or communications were accessed, modified, or transmitted.
Executive Summary
U.S. equities finished the first ten months of 2026 modestly in the green at the index level, but the gains are thinner and more fragile than the headline numbers suggest. The Nasdaq 100 led with a +17.49% year-to-date return, followed by the S&P 500 at +12.32%, the Russell 2000 at +10.84%, and the Dow at +7.76% https://www.topstocksytd.com. Yet beneath this calm surface, the market is showing classic signs of a late-cycle, rate-sensitive tape: narrow leadership, deteriorating breadth, and a sharp divergence between a handful of mega-cap names and the broader population. Breadth data tells a cautionary story — while 67% of S&P 500 constituents are positive year-to-date, the median return sits at just +7.94%, and the fraction of stocks above their 200-day average has fallen from roughly 70% to about 50% https://www.ainvest.com. In other words, the index is being carried by a concentrated set of winners while the middle of the market quietly erodes.
The macro backdrop is the dominant variable this edition. The Federal Reserve is in a hawkish, "higher-for-longer" posture with the funds rate at 3.75%–4.00% and the 10-year Treasury yield hovering near 5.3%–5.35% — the highest level since 2002 https://www.admirals.com. Inflation remains stubbornly above target (3.7% CPI, 3.01% core PCE), while the labor market has suddenly softened — September payrolls came in at a weak +29,000 against ~90,000 expected, with 60,000 prior months revised downward https://www.chase.com. This tension has caused markets to price out an October rate hike almost entirely: odds have collapsed from the ~35%–70% range earlier in the cycle to roughly 13%–23%, with most analysts now expecting a hold and the next move pushed to December or 2027 https://www.nowflation.com.
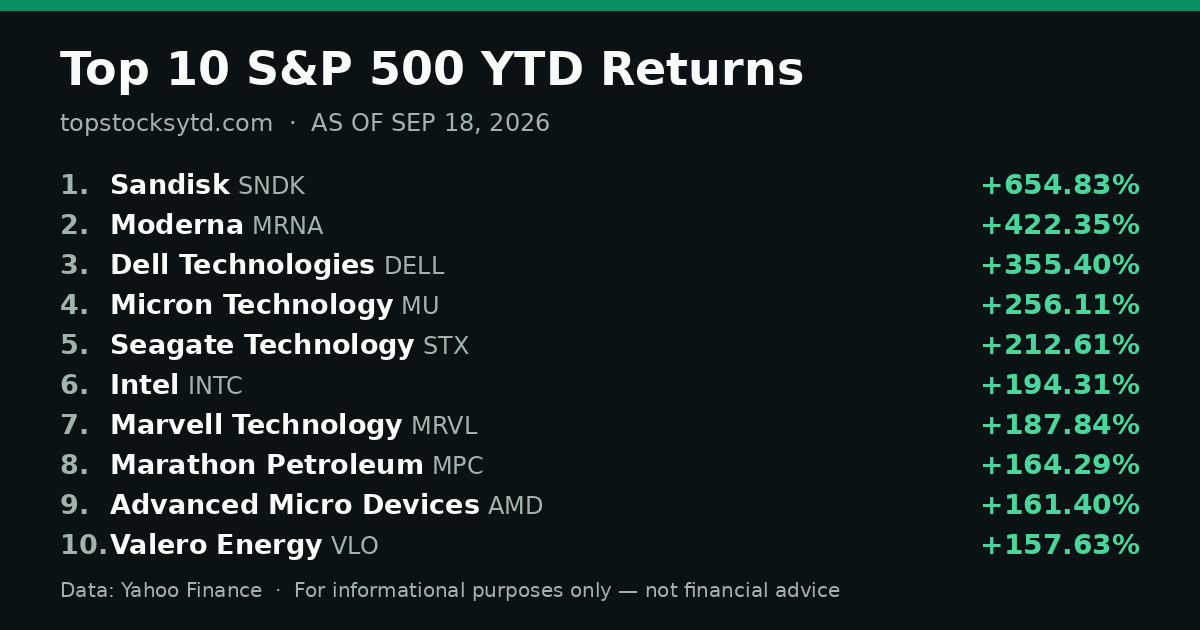
The performer data reinforces the dispersion thesis. On the upside, the biggest YTD winners are speculative biotech and semiconductor names (MGRT +1,393.75%, MRNA +639.27%, SNDK +447.4%), while October's monthly gainers skew toward small-cap tech and communications https://www.chartrow.com. On the downside, the story is far uglier: the 50 worst large-cap names have a median decline of -44.3%, micro-caps have collapsed 100%, and October's S&P 500 losers are dominated by semiconductors and data-infrastructure names https://www.statmuse.com. The net read is a market that is bullish on seasonality and earnings resilience, but increasingly bearish on valuation, concentration, and the path of monetary policy — a tension that defines the current environment.
1. Market Structure & General Trends

Index Performance and the Concentration Problem
The headline index returns for 2026 paint a picture of a market that has largely held its gains despite a hostile rate environment. The Nasdaq 100's +17.49% lead reflects the continued dominance of technology and AI-related names, while the S&P 500's +12.32% and Russell 2000's +10.84% suggest that the rally is not exclusively a mega-cap phenomenon — at least not yet. The Dow's more modest +7.76% reflects the drag from its heavier weighting in rate-sensitive, value-oriented sectors like financials and industrials, which have underperformed in a rising-rate world.
But index averages obscure a critical structural issue: concentration. The median S&P 500 stock has returned just +7.94% year-to-date, well below the +14.99% average — a gap that exists only when a small number of enormous names pull the mean far above the median. This is the signature of a market riding on a handful of leaders, which makes it vulnerable to a reversal if those leaders falter. The breadth data confirms the fragility. Roughly 50% of stocks now trade above their 200-day moving average, down sharply from 70% earlier in the year, and 52-week lows are outpacing 52-week highs https://www.ainvest.com. On the intraday tape, the Strasmore advance-decline line shows 59% of stocks advancing versus 41% declining, which is constructive on the surface but masks the underlying thinning https://www.strasmore.com.
The Macro Backdrop: A Fed Torn Between Two Data Sets
The single most important variable in today's market is the Federal Reserve, and this edition's findings reveal a central bank caught between a strengthening economy and a suddenly weakening labor market. The Fed funds rate sits at 3.75%–4.00%, and the 10-year Treasury yield is near 5.3%–5.35% — the highest since 2002 — which continues to compress valuations across the risk spectrum https://www.admirals.com. Inflation is the sticking point: CPI is running at 3.7% and core PCE at 3.01%, both comfortably above the Fed's 2% target, with energy-driven pressures amplified by the Iran conflict pushing oil above $100 https://www.chase.com.
The labor market, however, has turned. September payrolls came in at a meager +29,000 against ~90,000 expected, with 60,000 prior months revised downward and unemployment at 4.2% https://www.orbitremit.com. This divergence has created a genuine policy dilemma. The Taylor rule implies a neutral rate of 4.51% — roughly 63 basis points above the actual funds rate — suggesting policy is still mildly restrictive, while the Sahm rule sits at a calm 0.00, indicating no recession signal yet https://www.nowflation.com.
The market's reaction to this tension has been decisive. October hike odds have collapsed from the ~35%–70% range earlier in the cycle to roughly 13%–23%, with most analysts now pricing a hold at the October 27–28 FOMC meeting and the next move pushed to December (81% probability) or into 2027 https://www.orbitremit.com. There is a minor discrepancy worth flagging: Western Southern cited ~35% hike odds, but this likely predates the weak September jobs report, while Admirals (16–18%), Nowflation (86.5% hold), and Orbitremit (16–23%) all cluster in the low-to-mid teens after the data https://www.westernsouthern.com. The dot plot itself is divided — Chase cites 16 of 18 participants projecting one more hike in 2026, while Orbitremit cites nine of 18 — reflecting an unresolved debate over whether tightening is nearly complete or has further to go https://www.chase.com.
2. Best Performers
Year-to-Date Leaders
The YTD winners are dominated by high-beta, speculative names — a tell that risk appetite is concentrated in thematic, event-driven plays rather than broad-based participation.
| Ticker | Name | YTD Return |
|---|---|---|
| MGRT | — | +1,393.75% |
| MRNA | Moderna | +639.27% / +692.8% |
| SNDK | Sandisk | +447.4% / +471% |
| IBRX | Immunobio | +363.6% |
| TWST | Twist Bioscience | +355.2% |
| USO | Energy Select Sector ETF | +133.9% |
| MU | Micron | Semiconductor/AI leader |
| MRVL | Marvell | Semiconductor/AI leader |
The biotech concentration (MGRT, MRNA, IBRX, TWST) alongside semiconductors (SNDK, MU, MRVL) and energy (USO) reveals three distinct risk-on themes: clinical catalysts, AI infrastructure buildout, and the energy complex that has benefited from elevated oil prices. These are not broad-market leaders; they are thematic outliers, which reinforces the concentration concern.
October 2026 Monthly Gainers
| Ticker | Name | Monthly Return |
|---|---|---|
| BMBL | — | +132.94% |
| GIBO | — | +95.65% |
| QTEX | — | +91.18% |
| XLAB | — | +59.86% |
| PICS | — | +56.23% |
| BSP | — | +44.83% |
| XP | XP Inc. | +38.07% |
| PTC | PTC Inc. | +31.75% |
| Crown Castle | — | +24.41% |
| Petrobras | — | +23.93% |
October's gainers skew toward small- and mid-cap tech, communications, and financial-infrastructure names. It is important to note that this list draws from a broad universe of roughly 4,400 companies, so these are not S&P 500 leaders — they are the most volatile movers in a wider field, consistent with a risk-on rotation into smaller names.
Single-Day Movers (October 15, 2026)
| Ticker | Name | Daily Return |
|---|---|---|
| RXRX | Recursion Pharmaceuticals | +11.23% |
| KDNY | Kyndryl | +11.87% |
Both single-day gainers moved on specific corporate catalysts (see Fresh News below), underscoring that intraday leadership is event-driven rather than index-driven.
3. Worst Performers
Year-to-Date Large-Cap Losers
The large-cap downside is where the market's fragility becomes most visible.
| Ticker | Name | YTD Return |
|---|---|---|
| CTVA | Corteva | -80.8% |
| TTD | The Trade Desk | -65.7% |
| FLUT | Flutter Entertainment | -64.8% |
| APP | AppLovin | -61.06% |
| FICO | Fair Isaac | -54.4% |
| BSX | Boston Scientific | -53.63% |
ChartRow's universe of the 50 worst large-cap names carries a combined market cap of $998 billion and a median decline of -44.3%, with the least-bad name (SYM) still down -34.8% https://www.chartrow.com. Crucially, the losers are diverse across sectors — Consumer Discretionary (FLUT, STLA, XPEV, LULU, DKNG), Technology (FICO, INTU, FIS), Healthcare (BSX, PODD), and Real Estate (CSGP) — which suggests this is not a single-sector correction but a broad de-rating of names that were richly valued and sensitive to higher rates.
Year-to-Date Micro-Cap Collapses
| Ticker | YTD Return |
|---|---|
| HUBC | -100% |
| SXTC | -100% |
| CDT | -100% |
| WHLR | -100% |
A 100% decline represents total loss of equity value — these companies have gone to zero. The presence of four such collapses signals extreme tail risk in the smallest, least-liquid names, where leverage, dilution, and delisting risk are most acute.
October 2026 Losers
| Ticker | Name | Monthly Return |
|---|---|---|
| SKYD | Skydance | -31.65% |
| STX | Seagate | -29.87% |
| WDC | Western Digital | -26.52% |
October's S&P 500 losers are overwhelmingly concentrated in semiconductors and data infrastructure — Seagate, Western Digital, SanDisk, Intel, Super Micro, Applied Materials, Lam Research, Coherent, Teradyne, Micron, KLA, Marvell, and AMD https://www.statmuse.com. This is the clearest bearish signal in the edition: even the AI-capex complex is showing cracks, with storage and equipment makers leading the declines.
Single-Day Losers
Not extracted — the single-day S&P 500 losers were not captured in the source material.
4. Sector Outlooks
Year-to-Date Leadership
| Sector | Index Return | Median Stock Return |
|---|---|---|
| Energy | +56.75% | +23.4% |
| Information Technology | +43.11% | — |
| Health Care | +26.62% | — |
| Communication Services | — | -8.8% (lagging) |
Energy's dominant YTD return reflects the oil-above-$100 environment, while IT and Health Care have carried the index. Communication Services' negative median return is a notable laggard signal.
September Sector Performance
Per Western Southern, September saw Technology and Communication Services lead while Financials, Materials, Real Estate, Utilities, and Consumer Discretionary bore the brunt of the decline — a classic higher-rate rotation out of rate-sensitive value https://www.westernsouthern.com.
October Monthly Sector
Stocktitan's October data shows Consumer Defensive leading (+6.0% median) while Healthcare lagged (-6.0% median) https://www.stocktitan.com. This defensive rotation into consumer staples is consistent with a market that is becoming more risk-averse as the labor market softens.
The October Tension: Small-Cap Gains vs. Large-Cap Semis Weakness
There is an apparent contradiction worth resolving: October's monthly gainers (from the broad universe) lean toward tech and communications, while October's S&P 500 losers are dominated by semiconductors. The resolution is universe and capitalization. The gainers list draws from ~4,400 companies including small caps, while the losers are large-cap S&P 500 constituents. The takeaway is that large-cap tech/semis are dragging the index while smaller thematic tech names continue to trade on momentum — a divergence that heightens concentration risk.
Year-to-Date Underperformance
The sectors that have structurally underperformed year-to-date are Consumer Discretionary, Technology, Healthcare, and Real Estate — the very names that dominate the worst-performer lists, confirming that the de-rating is sector-wide rather than idiosyncratic.
5. Bullish & Bearish Theses

Bullish Theses
Seasonal tailwind. Historically, October is the strongest month of a midterm year, averaging +3% and finishing positive 73.7% of the time, with Q4 averaging 6.6% https://www.ainvest.com. Seasonality favors buyers.
Earnings resilience and multiple compression. The S&P 500 has compressed from ~22x to ~19x earnings, but exceptional earnings growth is outrunning the multiple contraction, and the economy is insulated by locked-in borrowing costs and healthy balance sheets https://www.westernsouthern.com.
Economy growing above trend. Chase argues the economy is expanding above trend despite tightening, supporting a "lean into equities" stance https://www.chase.com.
Thematic catalysts. Recursion's Sanofi partnership, Kyndryl's Toyota deal, Ericsson's strong Q3 (+6% net sales), and Quantinuum's Morgan Stanley overweight (~69% upside) provide name-specific momentum https://www.insidermonkey.com.
Fed data-dependence. The base case is one more 25bp hike, with officials signaling "no need for urgency" — a less threatening path than the worst-case scenario https://www.orbitremit.com.
Bearish Theses
Monetary risk / higher-for-longer. A hawkish Fed with 9–16 of 18 participants projecting additional tightening is a headwind for risk assets, as longer restrictive policy compresses valuations https://www.chase.com.
AI-concentration risk. Nearly half of 2026 growth may depend on AI capex offset by depreciation, making the tape fragile to a capex slowdown https://www.ainvest.com.
Breadth deterioration. Only ~50% of stocks sit above their 200-day average (down from 70%), with 52-week lows outpacing highs https://www.ainvest.com.
Weak labor market. +29,000 payrolls vs. 90,000 expected, with 60,000 downward revisions, signals an economy that may be decelerating faster than priced https://www.orbitremit.com.
Stubborn inflation. 3.7% CPI and 3.01% core PCE, amplified by energy pressures, keep the Fed from easing https://www.nowflation.com.
Semiconductor weakness. October's S&P 500 losers are dominated by semis and data infrastructure, suggesting the AI-capex complex is fracturing https://www.statmuse.com.
Large-cap drawdown and extreme tail risk. The 50 worst large-cap names carry a median -44.3% decline, and micro-caps have collapsed 100% https://www.chartrow.com.
6. Fresh News
- Recursion Pharmaceuticals — Announced a partnership with Sanofi, driving an +11.23% single-day gain https://www.insidermonkey.com.
- Kyndryl — Secured a deal with Toyota, contributing to an +11.87% daily move https://www.insidermonkey.com.
- Ericsson — Reported a strong Q3 with +6% net sales growth https://www.insidermonkey.com.
- Quantinuum — Given an overweight by Morgan Stanley, implying ~69% upside https://www.insidermonkey.com.
- Zilow Group — Supported by falling Treasury yields on the day, boosting the rate-sensitive real estate name https://www.insidermonkey.com.
Upstream catalysts to watch: CPI (Oct 14), PPI (Oct 15), retail sales (Oct 15), the FOMC meeting (Oct 28), and PCE (Oct 29). The September CPI print on October 14 is the pivotal near-term data point that could re-anchor hike expectations.
7. Data Gaps
- Single-day S&P 500 losers were not extracted.
- The bond/fixed-income reports were cut off mid-analysis and contributed only macro context.
- The Markets.com substantive body was not fully extracted (only the Eli Lilly $1,300 target was captured).
- The dot plot shows a source disagreement (16 vs. 9 of 18), which could not be reconciled.
- October monthly sector data (Stocktitan) and October S&P 500 losers (StatMuse) use different universes, limiting direct comparison.
Conclusion
The market in mid-October 2026 is a study in contrasts: index gains built on narrow leadership, a hawkish Fed, and a suddenly softening labor market. The best performers are speculative biotech and semiconductor outliers, while the worst performers reveal a broad, sector-wide de-rating of large-cap names — with the 50 worst large-caps down a median -44.3% and micro-caps at -100%. October's S&P 500 losers are dominated by semiconductors and data infrastructure, the very AI-capex complex that has carried the tape, signaling that even the market's favorite theme is fracturing.
The most defensible read is cautiously constructive on seasonality and earnings, but increasingly bearish on valuation, concentration, and monetary risk. The bullish case rests on historical seasonality, resilient earnings, and a Fed that appears data-dependent rather than aggressively hiking. The bearish case is stronger and more diversified: deteriorating breadth, a labor market that has quietly broken, stubborn inflation, and a large-cap universe that is broadly underwater. The tension between these two theses — a strong index over a fragile tape — is the defining feature of the current environment, and it argues for favoring quality and defensives (consumer staples, selective healthcare) over high-beta concentration as the FOMC and CPI data unfold in the weeks ahead.