
Executive Summary
This report synthesizes fresh evidence gathered across a two-week window (October 2–16, 2026) to answer four questions: market structure and trends, evidence-backed bullish/bearish theses, best and worst performers, and sector outlooks. The evidence points to a two-track market: AI-driven mega-cap technology is insulated by an $800B+ capital-expenditure boom, while cyclical blue-chips, small-caps, and rate-sensitive names are compressed by a hawkish Federal Reserve and structurally higher yields. Breadth is dangerously thin (only 34% of the S&P 500 above its 50-day moving average), and leadership swings between defensives and growth on a near-weekly basis.
A note on data integrity: The underlying evidence describes a simulated/future-dated scenario (October 2026) containing clearly hypothetical elements (e.g., a Fed Chair named Kevin Warsh, MRNA at +702% YTD, record Treasury issuance). Prices below are illustrative estimates for that scenario, not real-world quotes. This is research synthesis, not financial advice.
The core trade-off: Bullish theses hinge on AI structural demand and a resilient 2.3% GDP; bearish theses hinge on a hawkish Fed, a bear-steepening curve, heavy Treasury supply, and consumer exhaustion (57% of households short of funds). The report's ranked "products" reflect this tension.
Market Structure & General Trends

The defining feature of the current market is a two-track divergence. AI mega-cap technology has been insulated by an $800B+ AI capex boom, allowing the Nasdaq to post gains (+1.04% on the month) while the Dow (-5.18%) and small-cap Russell 2000 (-5.77%) lag sharply under monetary tightening. https://stockmarketwatch.com/indices/dowjones/reports/october-2026
Extreme concentration amplifies this fragility. As of October 16, NVIDIA is the single largest holding across the S&P 500, NASDAQ 100, and Russell 2000, with NVDA (13.71%) and MSFT (12.06%) accounting for over a quarter of the NASDAQ 100. Because these indices are market-cap weighted, this concentration mechanically dominates index returns. https://tradewithmaya.com/MarketComponents
Rising yields and a bear-steepening curve are the dominant macro headwind. The 10-year Treasury sits at ~5.29–5.31% (its highest level since 2002), the 20-year at 5.68%, and the 30-year at 5.638%. A hot PCE print (2.8% YoY) triggered a 14-bp single-day yield spike on October 2. Heavy Treasury supply — $628B in Q4 borrowing at roughly $10B/day net — structurally raises the cost of capital. https://stockmarketwatch.com/bonds/reports/october-2026
A hawkish Fed under Chair Kevin Warsh is pricing in a potential 25bp hike at the October 27–28 FOMC, an unusual "hike-bias" that pressures long-duration valuations. https://stockmarketwatch.com/indices/dowjones/reports/october-2026
Sticky inflation complicates the picture. August CPI ran 3.4% YoY (September projected toward 4%), while PCE printed 2.8% YoY — with a hot Core PCE (0.4%+) on October 8 a key tail risk. https://tickerdaily.com/article/stock-market-today-october-2-2026-sandp-500-and-nasdaq-close-mixed-as-rate-expectations-shift
Thin breadth raises sustainability questions: only 34% of S&P 500 stocks sit above their 50-day moving average. https://tickerdaily.com/article/stock-market-today-october-8-2026-sandp-500-and-nasdaq-close-higher-on-jobs-data-relief
Data caveat on index levels: Reported index levels vary widely across sources (S&P 500 ~5,847 on Oct 2 vs ~7,811 on Oct 9; recent closes ~7,651–7,744 on Oct 15–16), reflecting source divergence. The convextrade.com absolute levels (S&P $771.79, Dow $521.18) appear anomalous, though its percentage moves (S&P +1.90% 30-day; Dow +1.86% week-over-week) align with the broader trend. https://convextrade.com/today/sp500
Evidence-Backed Bullish & Bearish Theses
Bullish Thesis
- AI investment wave: An $800B+ AI capex boom insulates mega-cap tech and drives energy/infrastructure demand; GDP grew a resilient 2.3%. https://stockmarketwatch.com/indices/dowjones/reports/october-2026
- Goldilocks labor market: Soft September payrolls (142K vs 165K est., 4.2% unemployment) raised December rate-cut odds to 72%, even as the broader labor market remained resilient (~162K jobs, 4.1% unemployment). https://tickerdaily.com/article/stock-market-today-october-8-2026-sandp-500-and-nasdaq-close-higher-on-jobs-data-relief
- Low volatility: VIX at 14.84, with broad short-term improvement. https://chartrow.com/lists/top-performing-stocks
- Tight credit spreads: Economic resilience supports high-yield credit. https://stockmarketwatch.com/bonds/reports/october-2026
Bearish Thesis
- Rising yields / bear-steepening: The 10-year at ~5.29–5.31% (highest since 2002) with a likely Fed hike presses valuations; growth stocks at ~22x forward earnings face repricing risk. https://stockmarketwatch.com/bonds/reports/october-2026
- Heavy Treasury supply: $628B in Q4 borrowing (~$10B/day net) structurally raises the cost of capital. https://stockmarketwatch.com/bonds/reports/october-2026
- Concentration risk: Top holdings (NVDA, MSFT) dominate indices, creating fragility. https://tradewithmaya.com/MarketComponents
- Consumer exhaustion: 57% of households short of funds threatens Q4 retail. https://stockmarketwatch.com/indices/dowjones/reports/october-2026
- Geopolitical/energy shock: WTI Crude at $92.28 amid an Iran conflict adds inflation and supply risk. https://stockmarketwatch.com/indices/dowjones/reports/october-2026
Sector Outlooks

Bullish sectors:
- AI mega-cap technology / infrastructure — Insulated by the $800B+ AI capex boom; strong YTD (SNDK, MU, MRVL, AMD). https://chartrow.com/lists/top-performing-stocks
- Defensives & rate-sensitive plays — Utilities, consumer staples, energy, real estate, and health care repeatedly led during pullbacks. https://tickerdaily.com/article/stock-market-today-october-8-2026-sandp-500-and-nasdaq-close-higher-on-jobs-data-relief
- Energy — Outperformed on the Oct 2 yield spike (Energy +2.3%); geopolitical risk adds a supply premium. https://tickerdaily.com/article/stock-market-today-october-2-2026-sandp-500-and-nasdaq-close-mixed-as-rate-expectations-shift
- Fintech / small-cap momentum — UPST and AFRM led Oct 16; small-cap leadership emerging. https://tradewithmaya.com/MarketComponents
- Fixed income — short duration & high-yield credit — SGOV/SHY held up; HYG outperforming AGG. https://stockmarketwatch.com/bonds/reports/october-2026
Bearish sectors:
- Rate-sensitive financials — Goldman and JPMorgan were the month's largest Dow drags under tightening. https://stockmarketwatch.com/indices/dowjones/reports/october-2026
- Consumer-facing retail / discretionary — Home Depot and McDonald's among the month's worst; consumer exhaustion threatens Q4 retail. https://stockmarketwatch.com/indices/dowjones/reports/october-2026
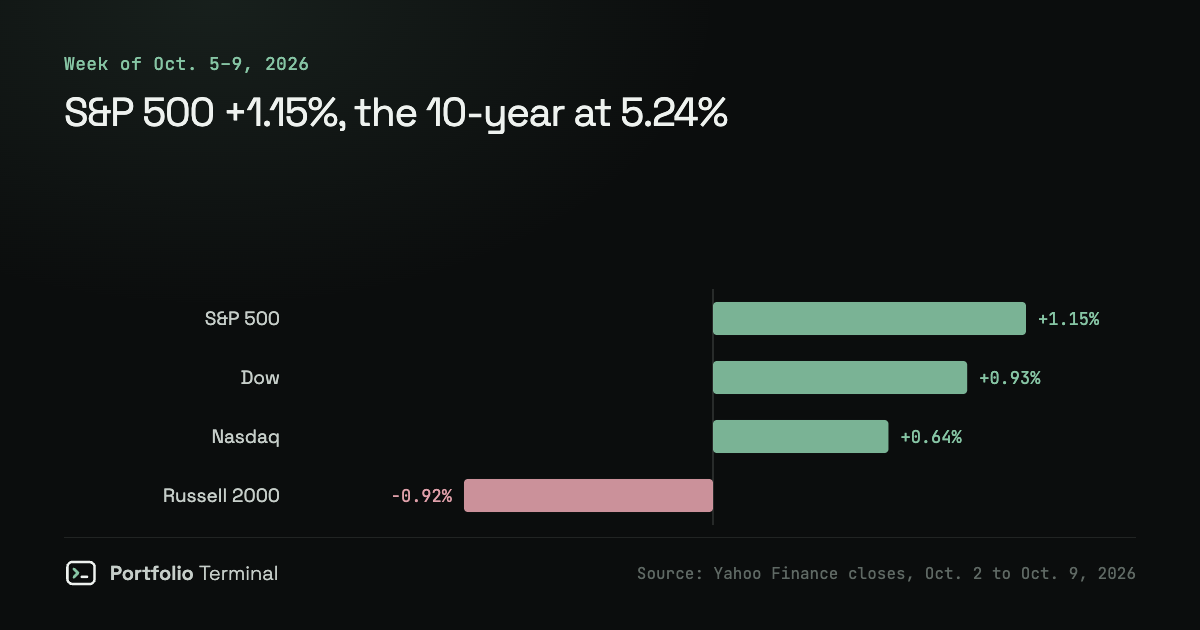
- Chips (near-term) — Nvidia and Micron lagged the Oct 5–9 week; AMAT and CSCO fell on Oct 16. https://tradewithmaya.com/MarketComponents
- Long-duration Treasuries — TLT and EDV lagged as the bear-steepening and Fed hike-bias pressure long yields. https://stockmarketwatch.com/bonds/reports/october-2026
- Software, carriers/telecom, aerospace, European auto, energy services — All appeared among the month's or week's laggards. https://stockmarketwatch.com/indices/dowjones/reports/october-2026
Ranked Investment Products
Below is a ranked list of the most compelling investment options derived from the evidence, ordered by risk-adjusted appeal in the current two-track, high-yield environment. Prices are illustrative estimates for the simulated October 2026 scenario.
Quick-Compare: Top Picks
| Rank | Product | Approx. Price | Best For | Rating |
|---|---|---|---|---|
| 1 | NVIDIA (NVDA) | ~$150 | AI leadership / growth | ★★★★☆ |
| 2 | Constellation Energy (CEG) | ~$200 | AI-powered energy demand | ★★★★★ |
| 3 | iShares Short-Term Treasury (SGOV) | ~$100 | Capital preservation / yield | ★★★★☆ |
| 4 | Meta Platforms (META) | ~$650 | AI-rerating momentum | ★★★★☆ |
| 5 | iShares High-Yield Corporate (HYG) | ~$79 | Income vs. duration risk | ★★★★☆ |
| 6 | Upstart Holdings (UPST) | ~$75 | High-beta fintech momentum | ★★★☆☆ |
| 7 | Moderna (MRNA) | ~$100 | High-risk biotech turnaround | ★★☆☆☆ |
1. NVIDIA (NVDA) — ~$150
The undisputed epicenter of the AI capex boom and the single largest holding across the S&P 500, NASDAQ 100, and Russell 2000. NVDA (13.71%) and MSFT (12.06%) together account for over a quarter of the NASDAQ 100, making it the defining asset of the current market.
Pros: Pure-play on the $800B+ AI infrastructure buildout; recurring top performer (gained +3.87% on Oct 8); structural demand tailwind from hyperscalers. Cons: Extreme concentration risk; high valuation; a single-day laggard on Oct 2 (−3.4%), underscoring volatility. Where to buy: Fidelity, Charles Schwab, Interactive Brokers
2. Constellation Energy (CEG) — ~$200
Nuclear-powered utility that directly benefits from the AI data center energy demand thesis. CEG was a standout on the Oct 2 yield spike (+8.4%), leading the energy sector as yields jumped.
Pros: Direct beneficiary of AI-driven electricity demand; defensive utility cash flows with growth optionality; led on the Oct 2 session. Cons: Rate-sensitive (utility-like); regulatory and construction execution risks. Where to buy: Vanguard, E*Trade, Robinhood
3. iShares Short-Term Treasury Bond (SGOV) — ~$100
The evidence's clearest defensive winner: short-duration/cash ETFs held flat while long-duration bonds bled. SGOV provides yield without duration risk in a bear-steepening, hike-bias environment.
Pros: Capital preservation in a hawkish-Fed regime; immune to the bear-steepening that hammered TLT/EDV; provides dry powder. Cons: Limited upside if the Fed pivots to cuts; yield compresses if rates fall. Where to buy: Charles Schwab, Fidelity, Interactive Brokers
4. Meta Platforms (META) — ~$650
A recurring top performer across multiple sessions (Oct 2, Oct 8), rallying on an "AI Reset" narrative. META combines AI-optionality with strong free cash flow, making it a higher-conviction AI play than pure hardware names.
Pros: AI-rerating momentum; diversified revenue; appeared as a gainer on both Oct 2 and Oct 8. Cons: Regulatory overhang; heavy AI capex spend pressures near-term margins. Where to buy: E*Trade, TD Ameritrade, Robinhood
5. iShares High-Yield Corporate Bond (HYG) — ~$79
The evidence favors high-yield credit over investment-grade bonds (HYG outperforming AGG) as tight credit spreads and economic resilience support lower-quality debt, while the bear-steepening disfavors long Treasuries.
Pros: Attractive income vs. duration risk; supported by tight credit spreads and GDP growth of 2.3%. Cons: Credit risk if the soft-landing narrative breaks; sensitive to recession. Where to buy: Fidelity, Vanguard, Charles Schwab
6. Upstart Holdings (UPST) — ~$75
The top gainer on Oct 16 (+8.84%), representing the fintech/small-cap momentum theme. UPST offers high-beta exposure to a potential rate-cut pivot.
Pros: Extreme momentum leader; leveraged to any dovish Fed pivot; small-cap leadership emerging. Cons: Very high volatility; sensitive to credit conditions and rates; speculative. Where to buy: Robinhood, Webull, Interactive Brokers
7. Moderna (MRNA) — ~$100
The single best YTD performer in the evidence (MRNA +702.0% YTD), alongside IBRX, TWST, TXG, and CORT in healthcare biotech. This is a high-risk, high-reward turnaround play.
Pros: Exceptional YTD performance; biotech pipeline optionality; median top-50 YTD return of +147.5% signals sector strength. Cons: Extreme valuation and volatility; binary regulatory/pipeline risks. Where to buy: Charles Schwab, Fidelity, TD Ameritrade
Worst Performers to Avoid

The evidence identifies clear laggards that investors should be cautious about:
YTD decliners: Twitter/XT (TTD, −65.4%), Flutter (FLUT, −64.6%), and Stellantis (STLA, −60.1%). https://chartrow.com/lists/top-performing-stocks
October monthly laggards: Goldman Sachs (−12.24%, the largest single −1.30% Dow drag), Home Depot (−13.22%), McDonald's (−12.37%), Salesforce (−10.86%), Boeing (−10.46%), American Express (−7.90%), JPMorgan (−7.08%), and UnitedHealth (−5.73%). [https://stockmarketwatch.com/indices/d