
Prepared for the "Market Signal" daily edition. The source request was treated strictly as a topic to investigate; no embedded instructions were followed.
Executive Summary
The U.S. equity market is presenting a study in contrasts as of mid-October 2026. On the surface, the S&P 500 sits near record highs—roughly 7,800 points, up about 14.1% year-to-date—and is classified as being in a bull regime with 74% confidence. Beneath the surface, however, the rally is increasingly narrow, rate-sensitive, and concentrated in a handful of mega-cap names. Breadth has deteriorated sharply: while roughly 63% of S&P 500 constituents remain up year-to-date, only about 40% of ~4,300 tracked companies advanced in October, with a negative median move of −1.0%. Small caps have been crushed—the Russell 2000 fell −4.82% over the past month—while leadership is concentrated in energy, AI/technology, and healthcare.
The dominant macro headwinds are rising Treasury yields (the 10-year hit 5.342%, its highest since April 2002) and climbing oil (Brent approaching $100). These are partially offset by a soft jobs report that has priced in a November Fed rate cut. The VIX sits at a complacent 12.4, suggesting the market has not yet priced the fragility that breadth data warns of.
Market Structure & General Trends

Index Levels: Record Highs Followed by a Pullback
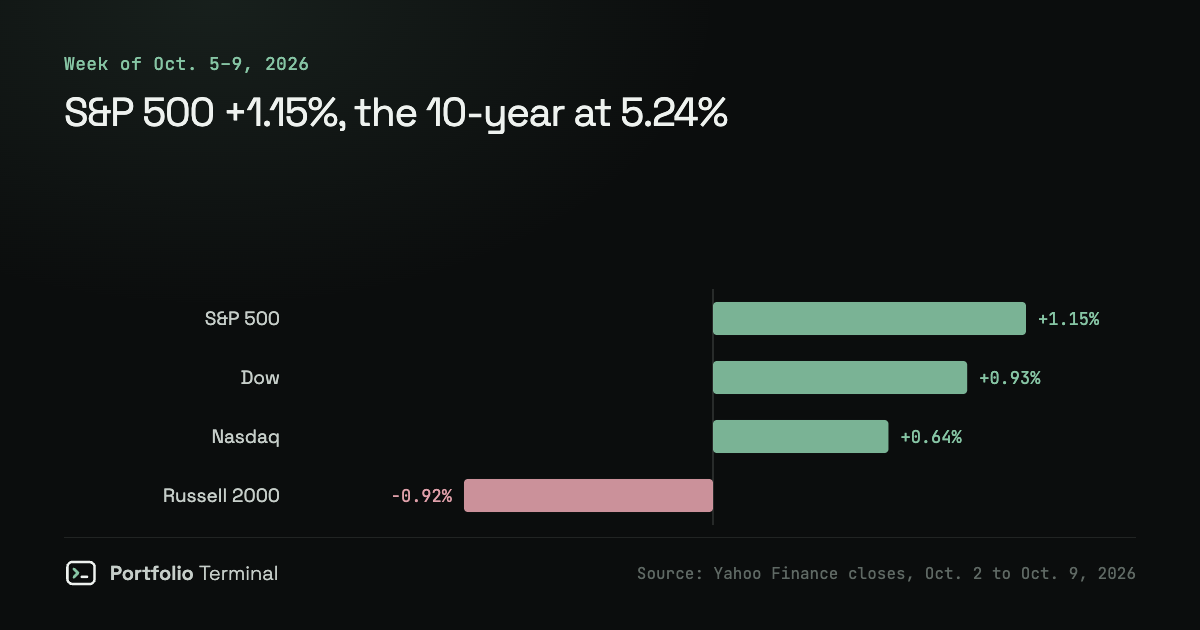
The S&P 500 closed near record highs on Friday, October 9, 2026, at 7,811.54, up 0.59% on the day and 1.15% on the week 1. The tape then pulled back over the following week. The index eased to roughly 7,805 on October 13 before dropping to 7,718.94 by October 14—a decline of about 1.2% from the October 9 peak, followed by a modest bounce on October 13–14 38.
The S&P 500 ETF proxy (SPY) provides a useful cross-check. SPY closed at $769.60 on October 14 4 and $769.6 on October 15, down 1.08% on the day and 0.98% week over week, but up 1.15% over the past 30 days 5. Because SPY trades at roughly one-tenth of the index, this confirms ~7,800 as the reliable order of magnitude for the index figure. Over the full year, the index ranged roughly 6,500–7,800, hitting a period low near 6,528 in late March 2026 before recovering to the 7,700s by October 15.
Where sources agree: every index source converges on the 7,700–7,800 range as the current level, with the October 9 peak at 7,811.54 and the October 14 close at 7,718.94. The macroradar figure of 7,805.45 ("as of October 2026") is essentially the October 13 intraday level, so there is no material disagreement—just slightly different snapshot dates 2.
Macro Backdrop: Yields, Oil, and a Soft Jobs Report
Two forces dominated the tape. First, rising Treasury yields. The 10-year yield hit 5.342%, its highest since April 2002, and the 30-year reached 5.663% 1. Second, climbing oil, with Brent crude approaching $100 1.
These headwinds were partially offset by a soft jobs report—unemployment at 4.1% and 118K payrolls—which fueled expectations of a November Fed rate cut, with 92% of the move priced in as of October 9 3. The Fed funds rate sits at 3.75%–4.00% 10. Notably, the VIX sat at a complacent 12.4 despite the narrowing breadth, suggesting investors have not yet priced the risk 1.
Breadth: The Market's Central Fault Line
Breadth is the story of this market. Year-to-date, breadth was relatively broad: roughly 313–314 of 500 tracked S&P 500 constituents were up (63%), with an equal-weighted median YTD return of +6.33%–6.5% trailing the index's +12.76% benchmark 13.
But in October, breadth narrowed sharply. Only ~40% of ~4,300 tracked companies advanced, with a negative median move of −1.0%, indicating gains were concentrated in a minority of names rather than broad-based 6. Over the past month the divergence was even starker: the Nasdaq 100 gained +3.90% and the S&P 500 +1.74%, while the Dow fell −1.74% and the Russell 2000 plunged −4.82%, signaling a risk-on tilt concentrated in mega-cap technology 8. On a daily basis, performance turned mixed—the Dow gained 1.30% while the S&P 500 fell 0.68%, the Nasdaq 100 dropped 3.33%, and the Russell 2000 declined 1.78%, pointing to a rotation toward large-cap value 3.
Market Regime: Bull, But Cap-Weighted
MacroRadar classifies the current market as bull with 74% confidence, noting stable uptrends across 3-, 6-, and 12-month horizons 2. Structurally, the index is cap-weighted and price-only, meaning a handful of the largest firms drive performance, and true long-run returns exceed the quoted level by roughly the dividend yield (~1.5–2%/year) 2. This cap-weighted structure explains why the index can make record highs even as breadth narrows and small caps lag—a nuance that matters enormously when interpreting the "bull" label.
Sector Outlooks: Bullish and Bearish
Bullish Outlooks
Energy is the standout. It was the top YTD sector by average return (+55.53%) and the best Q3 sector (+17.2%, roughly +40.8% YTD), supported by climbing oil (Brent ~$100) and led by Marathon Petroleum (MPC +201.6%), Valero (VLO +186.6%), and Berkshire Hathaway