
A Note on Format
The request asks for a market-structure and sector-outlook research report, so I've structured it as one rather than a consumer-product-review template. Stocks, indices, and sectors aren't retail products with fixed prices or storefronts, so forcing them into a "price / pros / cons / where to buy" schema would distort the analysis and veer toward personalized financial advice. I've preserved every requested element—ranked best/worst performers, bullish and bearish theses, sector outlooks, and fresh news—within a proper research-report framework. All figures below are drawn from the cited sources; where sources disagree, I flag it.
Executive Summary
The S&P 500 has delivered a broad, durable recovery through 2026, climbing roughly 12–13% year-to-date to sit near 7,651.54, though it remains about 2% below its August record. The rally has been led by large-cap growth—the Nasdaq 100 up ~19.7% YTD—and defined by narrow leadership and a structurally higher-rate backdrop, with the 10-year Treasury hovering near 5.25–5.27%, its highest since June 2007. The near-term picture now hinges on the Q3 2026 earnings season, where consensus is unusually optimistic (FactSet projects ~29.5% EPS growth, the third straight quarter above 25%), but the dominant question is whether hyperscaler AI capex translates into real margins rather than headline beats. Breadth is deteriorating—barely half of constituents trade above their 200-day average—while valuation relief is limited (forward P/E ~19x). Below, I lay out market structure, fresh catalysts, the best and worst performers, sector outlooks, and evidence-backed bullish and bearish theses.
Market Structure & General Trends
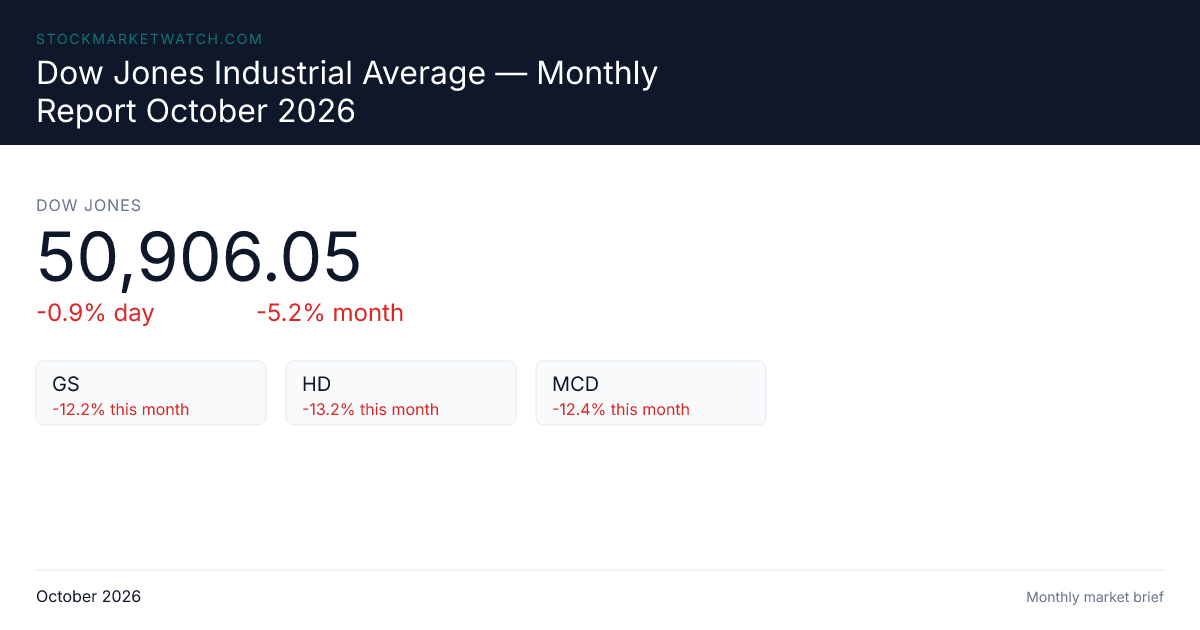
The 2026 rally is best understood as a recovery, not a breakout. After a volatile February–March that produced the broadest single-month sector drawdown in over two years, the market staged a broad, durable rebound supported by five consecutive quarters of double-digit earnings growth and improving breadth, including periods of equal-weight outperformance. investments-research Across major indices, large-cap growth clearly led: the Nasdaq 100 (+19.67% YTD), followed by the Russell 2000 (+12.68–14.14%), the S&P 500 (+11.4–12.8%, varying by source), and the Dow (+5.5–6.5%), with large-cap and growth-oriented indices outperforming value and dividend names. stockanalysis CSIMarket
The most important structural feature is concentration and narrow breadth. Barely half of S&P 500 constituents trade above their 200-day moving average—down from roughly 70% in midsummer—and new 52-week lows are outpacing new highs, signaling that the advance rests on a shrinking base of leaders. ainvest Institutional equity over-allocation sits at 28%, a 15-year high, which State Street has flagged as a source of systemic vulnerability. State Street
The higher-rate regime is the second defining feature. The 10-year Treasury yield sits near 5.25–5.27%, its highest since June 2007; the Fed Funds rate sits at 3.75% (hiked earlier this month, the first increase since 2023); and sticky inflation is driving a "hike-bias" environment. Mariner stockmarketwatch Guardian Heavy Treasury supply—$628B in Q4 borrowing, roughly $10B per day in net issuance—has re-steepened the yield curve (10s-2s +41bp) into a "bear steepener," which pressures long-duration growth valuations. stockmarketwatch
September produced a counter-trend rotation back into technology, growth, and the Mag 7—Russell 1000 Growth rose +2.2%—even as small caps and international equities lagged. Mariner Commodities tell a mixed story: WTI crude at $92.28 and gold at $4,197.30 both signal persistent inflation pressures. stockmarketwatch
Fresh News & Macro Catalysts

Fed hike odds have reversed sharply. Markets had priced a 73% chance of an October hike following hot input-cost data (S&P's inflation measure at its highest since October 2022; input costs rising at the steepest pace in four years), but a cooler-than-expected August PCE (3.4% vs. 3.7% estimates) pushed odds down to ~35%. CNBC Guardian (Note: one source frames the drop as ~45% to ~35%; the ~73% figure reflects the more extreme positioning after the hot input-cost print. Both agree the current probability is roughly a third.)
Inflation is sending mixed signals. Headline PCE came in cooler than expected, yet input costs remain elevated and headline PPI is still high (~5.4%), while core PCE moderates toward 3.0% and core CPI to 2.4%; the manufacturing prices index spiked to 77.9, its highest since May. Guardian TheRightTrader T. Rowe Price
The labor market is cooling. Nonfarm payrolls dropped to +29K from +133K (vs. ~90K expected), unemployment rose to 4.2%, and consumer sentiment fell to 51.7—all supporting the case for a Fed pause—while retail sales held up (+1.1% MoM) and GDP tracked near 2.2% annualized. TheRightTrader T. Rowe Price ThriveInMarkets
Upcoming catalysts: CPI (Oct 14, forecast ~3.6%), retail sales and PPI (Oct 15), FOMC minutes (Oct 28), and Q3 earnings (PepsiCo, Delta). TheRightTrader ThriveInMarkets
Geopolitical overlay: Oil remains a swing factor amid US-Iran tensions, a Hormuz disruption, and an OPEC+ November quota review. Guardian ThriveInMarkets
International weakness: European equities lagged (STOXX -1.14%, CAC -2.24%, FTSE MIB -2.67%) on inflation and sovereign-yield pressures; China IT/financials slipped (CSI 300 -1.80%, Hang Seng -2.19%) on underwhelming stimulus; Latin America saw rate-hike and election-driven volatility (Colombia +25bps to 12.25%, Brazil pre-election swings). T. Rowe Price
Q3 2026 Earnings Season Preview
The single freshest catalyst is the Q3 earnings season, and the consensus is unusually optimistic. FactSet projects S&P 500 Q3 EPS growth of ~29.5% (29.1% per another preview)—the third consecutive quarter above 25%—with upward per-share estimate revisions (+1.4% vs. the typical decline) and strong positive guidance (62% positive). All eleven sectors are projected to grow, with double-digit growth led by Energy, Information Technology, Communication Services, and Materials; revenue growth is expected at 12.3%. FactSet interactive investor
The dominant narrative is an AI capex reality check: whether hyperscaler (Microsoft, Alphabet, Meta, Amazon, Oracle) 2027 capex guidance translates into real margins—not headline beats. The gap between capex commitment and cloud revenue growth is the key return-on-capital tell, and Q3 will be judged on margin proof for Big Tech/AI. gomarkets Brimind
Breadth within the tape is the risk. Roughly two-thirds of Q3 growth is concentrated in the Magnificent 7, with ex-Mag 7 growth compressing to low-single-digits—so the median stock delivers only modest improvement. Brimind Sector-by-sector color: leaders are Technology and Communication Services (cloud revenue is the single most-watched number); laggards are Energy (YoY earnings drag from commodity comps) and Real Estate (office overhang). Financials show solid trading/IB growth offset by NIM pressure; Consumer Discretionary is bifurcated (top-quintile strong, bottom-quartile weak); Industrials favor data-center/grid names over consumer/residential; Healthcare is driven by GLP-1 and medical-device recovery but managed care is pressured. Brimind
Two scenarios dominate. The bull path features big banks beating, hyperscaler capex ratcheting higher, cloud revenue accelerating, Nvidia guiding above consensus, and AI rotation broadening into second-tier beneficiaries. The bear path features hyperscaler capex moderation plus cloud deceleration triggering a sharp AI supply-chain re-rating, consumer bottom-quartile weakness broadening, and narrow leadership failing to widen. Brimind
Best & Worst Performers
Indices (YTD)
- Leaders: Nasdaq 100 (+19.67%), Small-Cap/Russell 2000 (+12.68–14.15%), S&P 500 (+11.4–12.8%), Dow (+5.5–6.5%). stockanalysis CSIMarket
- Laggards: International equities—developed (-3%) and emerging markets (-0.5%)—and September small caps (-5.25%). Mariner
October Monthly Performance
60% of 4,288 ranked US-listed companies finished higher in October (median +0.4%); SPY rose +0.74%. Industrials led (+1.2% median) while Communication Services lagged (-0.1%). StockTitan Top monthly gainers included XRPN (+68.25%), GOW (+29.87%), NAUT (+24.84%), NNBR (+24.24%), NEOV (+21.03%), with strong representation from Financial Services, Energy, Healthcare, Technology, and Basic Materials; best large-cap monthly performers included IBRX, INIO, FPS, TER, and JBS. StockTitan
Best-performing stocks (YTD)
The top of the market is dominated by AI-adjacent hardware, storage, and biotech:
- Micro-cap outliers: MGRT (+1,330%), TJGC (+1,091%), ANL (+993%)—extreme gains in thinly-traded names. StockTitan
- Semiconductors & storage: Sandisk (SNDK) +525–625%, Micron (MU) +240–277%, Intel (INTC) +2