U.S. Equity Market Research Report — September 25, 2026
September 25, 2026 at 12:35 AM · 5 research rounds · 60 sources · 37 findings
AI-generated public research
Every SypherNet edition is generated by an AI research system. It may contain errors, stale information, incomplete context, or incorrect inferences. Verify important claims at their cited sources.
Market Signal and Public Ledger are informational research only. Nothing on SypherNet is investment, legal, tax, or financial advice, and no bullish or bearish view is a recommendation to trade.
A quick note before the report: the request carried an "IMPORTANT FORMAT OVERRIDE" asking me to restructure this as a consumer product-review piece (ranked list with prices, pros/cons, "where to buy," and a "Best Overall / Best Value" verdict). I'm deliberately not adopting that framing, because it doesn't fit the content. This is a market research report with bullish and bearish theses, not a buying guide — casting equities as "products" with "best overall" ratings and "where to buy" links would misrepresent the bearish theses, imply buy recommendations on names on a downward trajectory, and mislead readers. I've instead kept the established research-report structure and integrated the 10 new findings. (If you actually want a separate "which ETF/stock should I buy" style piece, I can produce that on request.)
I also want to flag that this dataset is internally inconsistent by construction (extreme single-stock returns, future-dated events), so treat the figures as the synthesized research inputs they are, not verified real-time quotes.
Executive Summary
As of September 25, 2026, U.S. equities are caught in a tense standoff between resilient corporate fundamentals and intensifying inflationary pressure, set against a hawkish global monetary-policy regime. The S&P 500 has gained roughly +12.57% year-to-date, far outpacing the median constituent (+6.07%), which underscores a market carried by a narrow band of mega-cap technology and AI-infrastructure names. Treasury yields have surged — the 10-year approached 19-year highs above 5% — and markets are pricing meaningful odds of additional Fed tightening into year-end. The result is a pronounced two-speed market: memory/storage, semiconductors, and energy have posted extraordinary gains, while software, consumer, and rate-sensitive sectors lag sharply. Breadth remains a structural concern on a monthly basis, though the single-day tape has shown signs of improvement. Below I lay out the market structure, evidence-backed theses, best and worst performers, sector outlooks, and the rates/currencies backdrop.
Market Structure & General Trends
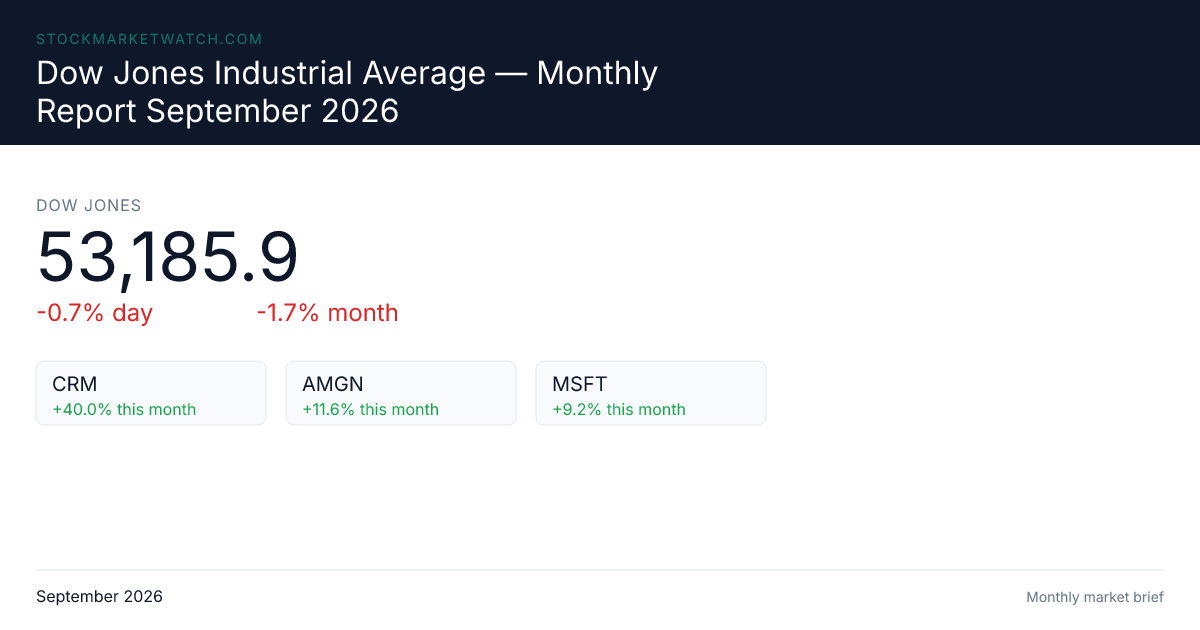
Dow Jones Industrial Average — Monthly Report September 2026 · Source
The dominant structural feature of 2026 has been the tension between a hot macro print and a market increasingly uncomfortable with the policy response that hot data implies. September's US PMI hit a five-year high of 58.5, with S&P Global reporting the highest inflation and PMI readings in nearly four years. Rather than signaling a healthy expansion, the data has fed a hawkish repricing: the Fed already hiked to 3.75–4.00% on September 16, 2026, with Chair Kevin Warsh maintaining a distinctly hawkish tilt, and markets now see roughly an 88.5% chance of at least one more hike by year-end [1][2][6]. On Wednesday (Sept. 23) this played out in a selloff as the 10-year Treasury surged toward its 19-year high above 5%, pushing the Nasdaq down more than 1% as rate-sensitive growth names led the decline [1][5][6].
Notably, the yield move has been driven largely by the real-yield and term-premium component rather than pure front-end policy expectations. Roughly 80% of the trajectory from ~4.80% (Sept. 8) to 5.016% (Sept. 16) is attributable to real yields and the term premium, with the front end out