

Market Signal Report — August 20, 2026
Executive Summary
U.S. equities have extended their march to record highs, with the S&P 500 and Dow Jones Industrial Average posting new all-time peaks as of mid-August 2026. However, this headline strength masks a deeply bifurcated market structure defined by severe internal rotation. The rally is being driven almost exclusively by a dominant AI and semiconductor supercycle, supported by a $630 billion capital expenditure build-out, while traditional industrials, legacy technology, and rate-sensitive sectors face significant headwinds. The environment is best described as a "two-market" dynamic: cap-weighted indices are soaring on the back of mega-cap tech leaders, while equal-weighted and broad-market participation remains uneven.
Monetary policy remains the primary macro friction. The Federal Reserve is expected to hold the federal funds rate at 3.50–3.75% through 2026, with market pricing for the September FOMC meeting reflecting a ~71.5% probability of a hold, a ~28.9% probability of a 25bp hike, and only a ~1.2% chance of a cut. This hawkish skew, supported by a balanced labor market (4.1% unemployment) and sticky core PCE, suggests a consolidation phase where rate relief is off the table. Consequently, capital is concentrating in AI beneficiaries, energy producers, and financial names supported by margin expansion, while rotating out of sectors vulnerable to elevated capital costs. The September FOMC decision stands as the critical inflection point; while near-term probabilities favor a hold or potential tightening, the structural bull case for AI and energy remains intact, even as macro deceleration (GDP at 1.5%) and consumer strain (savings rate at 2.7%) pose risks to cyclicals and rate-sensitive equities.
Market Structure & General Trends

The Record High Paradox: A Bifurcated Rally
The S&P 500 secured a third consecutive weekly gain as of August 14, pushing the index to new all-time records [6]. Yet, this performance tells only half the story. The market is exhibiting a profound divergence between price-weighted and market-cap-weighted indices. The Dow Jones Industrial Average is notably lagging its S&P 500 counterpart, a signal that the breadth of the rally is narrowing [5]. This lag is driven by the Dow's heavy exposure to industrial and legacy technology names that are not aligned with the current AI supercycle [5].
This "two-market" environment implies that the average investor may be underperforming the headline index if their portfolio lacks exposure to the specific sectors driving the rally. Capital is flowing aggressively into AI infrastructure beneficiaries and energy producers, creating a rotation that leaves traditional industrials and legacy tech behind. The S&P 500's record highs are thus less a reflection of broad-based economic health and more a testament to the earnings power and valuation premium commanded by a select group of AI-enabled mega-caps. This concentration increases the market's sensitivity to any disruption in the AI narrative, as the index's stability is heavily reliant on a narrow band of constituents.
ETF Data Confirms AI Supremacy
Exchange-traded fund (ETF) performance data across multiple timeframes provides empirical confirmation of this rotational friction. Analysis of 3-month, year-to-date (YTD), and 52-week performance horizons reveals that specialized AI and semiconductor ETFs are the dominant performers [1][2]. Leveraged equity ETFs have also appeared in the top rankings, reflecting strong momentum and a high risk appetite among institutional and retail investors chasing growth themes [2].
The dominance of these products across such varied timeframes suggests that the AI trade is not merely a short-term momentum play but a sustained structural allocation shift. However, the outperformance of leveraged products also signals elevated sentiment and potential fragility; when leverage leads the market, corrections can be more severe if the underlying thesis faces any doubt. The ETF data underscores a market where conviction is high in growth themes, but participation is selective, reinforcing the view that we are in a consolidation phase where direction is heavily influenced by the interplay between neutral macro fundamentals and the upcoming September FOMC decision [5][7][9].
Macro Friction & Monetary Policy
The September FOMC Inflection Point
The Federal Reserve's stance is the central variable shaping market expectations. The federal funds rate is currently held at 3.50–3.75%, with a terminal rate priced near 3.96% [6]. This terminal rate implies that the market is pricing in the possibility of further tightening rather than easing, a scenario that poses immediate downside risk to rate-sensitive sectors.
Prediction markets for the September FOMC meeting reflect this hawkish bias. There is a ~71.5% probability of a hold, a ~28.9% probability of a 25bp hike, and only a ~1.2% chance of a cut [7][9]. This distribution is significant: the combined probability of a hold or hike is nearly 100%, effectively removing the "rate relief" narrative that has supported valuations in previous cycles. The hawkish pricing is supported by a balanced labor market, with unemployment at 4.1%, and sticky core PCE inflation [9].
Sources generally agree on the hawkish skew. Both [7] and [9] cite similar probabilities for the September meeting, reinforcing the consensus that the Fed is in no rush to ease. However, [3] offers a nuanced counterpoint regarding the fixed-income market, noting that bonds are characterized by stability and are viewed as offering reliable income as interest rates moderate. This suggests that while equity valuations face compression, the bond market may provide a defensive counterbalance, particularly for investors seeking yield in a high-rate environment.
Neutral Fundamentals: GDP, Labor, and the Yield Curve
The broader macro environment is characterized by a consolidation phase with mixed signals. GDP growth has decelerated to 1.5%, signaling a weakening economy that threatens corporate revenue growth in cyclicals [5]. This deceleration is juxtaposed against a resilient labor market, with unemployment holding at 4.1% [9]. The yield curve is roughly flat, with a spread of +0.53%, a neutral signal that suggests neither imminent recession nor overheating [9].
The flat yield curve is particularly important; it indicates that the market is pricing in a "Goldilocks" scenario where growth is slowing but not contracting, and inflation is persistent but not spiraling. This environment favors value-oriented and defensive strategies, as growth stocks face headwinds from elevated capital costs while recession plays lack the momentum to attract capital. The 30-Year Treasury Yield stands at 5.28%, elevating the cost of capital and disproportionately hurting traditional industrials and rate-sensitive sectors [3]. This high long-term rate environment reinforces the rotation toward sectors that can generate cash flows independent of borrowing costs, such as AI beneficiaries with strong balance sheets and energy producers benefiting from geopolitical premiums.
Evidence-Backed Bullish Theses

The $630 Billion AI Capex Supercycle
The most compelling bullish thesis rests on the scale of AI capital expenditure. A $630 billion AI capital expenditure supercycle is driving earnings and valuations for mega-cap technology leaders [5]. Microsoft (MSFT) and Amazon (AMZN) are identified as primary beneficiaries of this infrastructure build-out, with their cloud computing dominance positioning them to capture value from enterprise AI adoption [5].
This capex cycle is not speculative; it is backed by the actual spending commitments of the largest technology firms. The dominance of AI/semiconductor ETFs across all measured timeframes confirms that this narrative has translated into broad market participation [1][2]. The bullish case is further supported by the potential for long-term rate relief; while near-term probabilities favor a hold or hike, structural growth in AI and energy productivity may eventually justify rate cuts, supporting multi-year valuation expansion for high-quality growth assets [9].
Energy Tailwinds and Financial Margin Expansion
Geopolitical energy shocks are providing a sustained tailwind for the energy sector. Crude producers are benefiting from elevated crude prices, with ExxonMobil (CVX) identified as a key beneficiary [5]. The energy sector serves a dual role in this environment: it provides exposure to a sector with strong earnings momentum and acts as an inflation hedge in a world where core PCE remains sticky.
Simultaneously, the restrictive monetary stance supports net interest margins (NIM) for banks. Market analysis suggests that financials may outperform in this environment, benefiting from higher rates even as growth sectors face headwinds [8]. The combination of strong NIM and a balanced labor market (which supports loan demand) positions the financial sector as a defensive growth play. Value and defensive strategies are also positioned to hold favor in this consolidation phase, as the flat yield curve and balanced labor data support a rotation toward quality and income-generating assets [9].
Evidence-Backed Bearish Theses
Decelerating Growth and Consumer Strain
The bearish case is anchored in the deceleration of GDP growth to 1.5%, which signals a weakening economy that threatens corporate revenue growth, particularly in cyclicals [5]. This macro slowdown is compounded by significant consumer strain. The personal savings rate has contracted to 2.7%, indicating a limited consumer buffer against shocks and potential downside risk to consumption-dependent sectors [5].
When consumers are drawing down savings at this rate, discretionary spending becomes vulnerable to any further economic deterioration. This creates a risk of a demand shock that could challenge the earnings growth of even AI beneficiaries if enterprise spending slows in response to weaker consumer demand. The deceleration in GDP also raises the specter of a "soft landing" turning into a "no landing" scenario, where inflation persists while growth stalls, forcing the Fed to maintain restrictive policy for longer than markets anticipate.
The Threat of Further Tightening
The ~28.9% probability of a 25bp hike at the September FOMC meeting cannot be ignored [6][7][9]. While a hold is the base case, the possibility of tightening further implies that the Fed views inflation as still too elevated. A hike would increase the cost of capital, disproportionately hurting traditional industrials and rate-sensitive sectors [3]. The terminal rate of 3.96% suggests that the Fed may tighten further rather than ease, removing the near-term rate relief narrative [6].
This hawkish pricing reflects sticky core PCE and strong labor data, posing immediate downside risk to rate-sensitive sectors [6][7][9]. Companies with heavy exposure to traditional industrials and legacy technology (e.g., Caterpillar, IBM) face structural headwinds from the combination of low GDP growth and high capital costs [5]. The bearish case is not necessarily a collapse of the bull market, but rather a deepening of the bifurcation, where the "market" continues to rise on AI and energy while the "economy" struggles with deceleration and consumer strain.
Best and Worst Performers
Top Performers: AI, Energy, and Leveraged Growth
The best performers are concentrated in sectors aligned with the AI supercycle and geopolitical energy premiums. Microsoft (MSFT) and Amazon (AMZN) are leading the market via AI infrastructure demand and cloud computing dominance [5]. ExxonMobil (CVX) is benefiting from geopolitical energy premiums and crude price support [5].
At the ETF level, specialized AI and semiconductor funds are among the best performers across all measured timeframes (3-month, YTD, 52-week), confirming the breadth of the tech rally [1][2]. Leveraged equity ETFs have also appeared in the top rankings, reflecting strong momentum and risk appetite in growth sectors [2]. Financial sector names are positioned to outperform due to margin expansion supported by the restrictive rate environment [8].
Worst Performers: Industrials and Legacy Tech
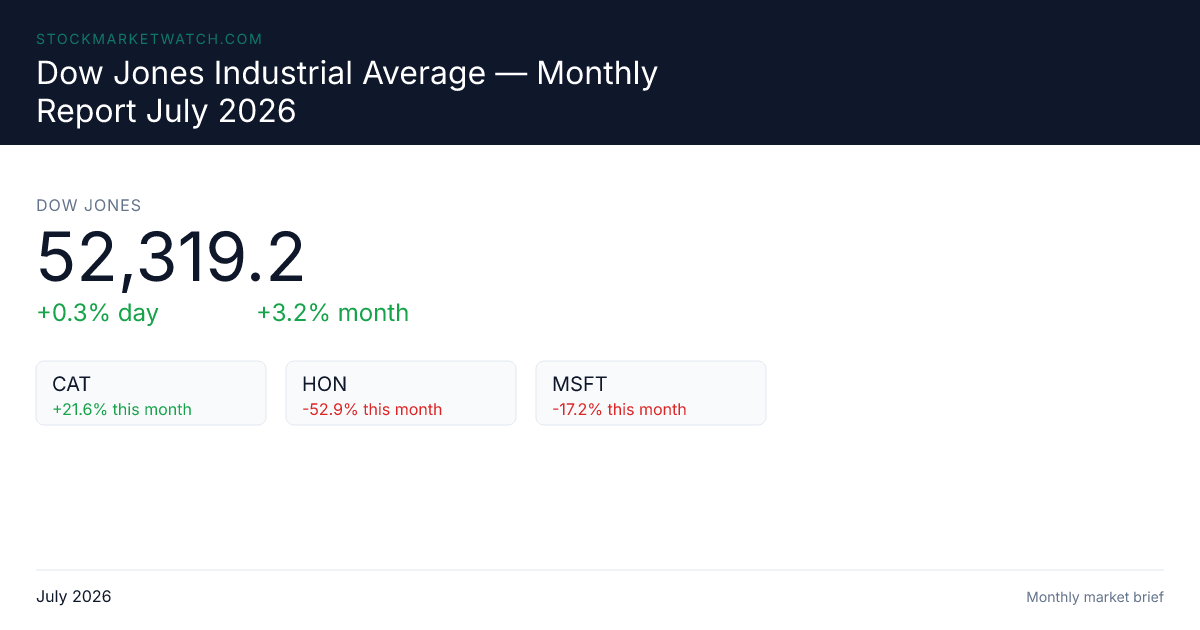
The worst performers are those most exposed to the macro headwinds of decelerating GDP and high capital costs. Caterpillar (CAT) and IBM are lagging due to decelerating GDP and high capital costs [5]. These names represent the "old economy" that is being rotated out of as capital flows toward AI and energy.
The Dow laggers, specifically price-weighted components not aligned with AI/tech, are underperforming the S&P 500 and Nasdaq [5]. Rate-sensitive equities, including utilities and real estate proxies, face valuation compression as the probability of a September rate hike rises [8][9]. While banks benefit from margins, broader rate-sensitive sectors are pressured by the cost of capital, creating a clear divergence between financials and other income-oriented sectors.
Sector Outlooks
Bullish Sectors
- AI / Technology: 🟢 Bullish. Driven by the $630B capex supercycle, earnings support, and ETF dominance across timeframes. MSFT and AMZN are primary beneficiaries.
- Energy: 🟢 Bullish. Geopolitical shocks boosting crude; CVX leading; serves as an inflation hedge.
- Financials: 🟢 Bullish. Restrictive rates support NIM; potential for outperformance vs. growth. Banks benefit from the high-rate environment.
- Value / Defensive: 🟡 Stable/Bullish. Consolidation phase and flat yield curve favor value-oriented strategies and quality income assets.
Bearish Sectors
- Traditional Industrials: 🔴 Bearish. GDP deceleration (1.5%); high capital costs; CAT lagging.
- Legacy Tech: 🔴 Bearish. Rotation out of old-economy tech; IBM underperforming.
- Rate-Sensitive Equities: 🔴 Bearish. 30Y yield at 5.28%; ~29% hike probability at Sept FOMC pressures valuations.
- Bonds / Fixed Income: 🟡 Stable/Income. Market offers stability and income as rates moderate; counter to equity volatility.
Conclusion
The market is at a structural inflection point defined by extreme sector divergence and a macro consolidation phase. While records are being set on the back of an AI-driven earnings and capex narrative, the underlying macro data—low GDP growth of 1.5%, a contracting savings rate of 2.7%, and elevated 30-year yields at 5.28%—poses significant risks to traditional sectors. The September FOMC meeting is widely expected to hold rates or potentially hike, with a terminal rate near 3.96%, removing the near-term rate relief narrative.
This environment supports financial sector margins, energy producers, and value-oriented strategies, while pressuring rate-sensitive equities, industrials, and legacy tech. The best stock performers (MSFT, AMZN, CVX) and best ETF performers (AI/Semiconductor funds) are those aligned with the AI supercycle and geopolitical energy premiums. The worst performers (CAT, IBM, Dow laggers) are those exposed to decelerating growth and high capital costs.
Investors should maintain exposure to AI and energy leaders, consider financial and value names for margin tailwinds and defensive resilience, and hedge against rotational risk in industrials, legacy tech, and rate-sensitive sectors. The upcoming earnings and labor data will provide directional clarity on whether the bull market can sustain breadth or if macro headwinds will force a correction. The "two-market" dynamic suggests that portfolio construction must be highly selective; a broad market approach may underperform significantly in this environment of concentrated leadership and macro friction.