

Executive Summary
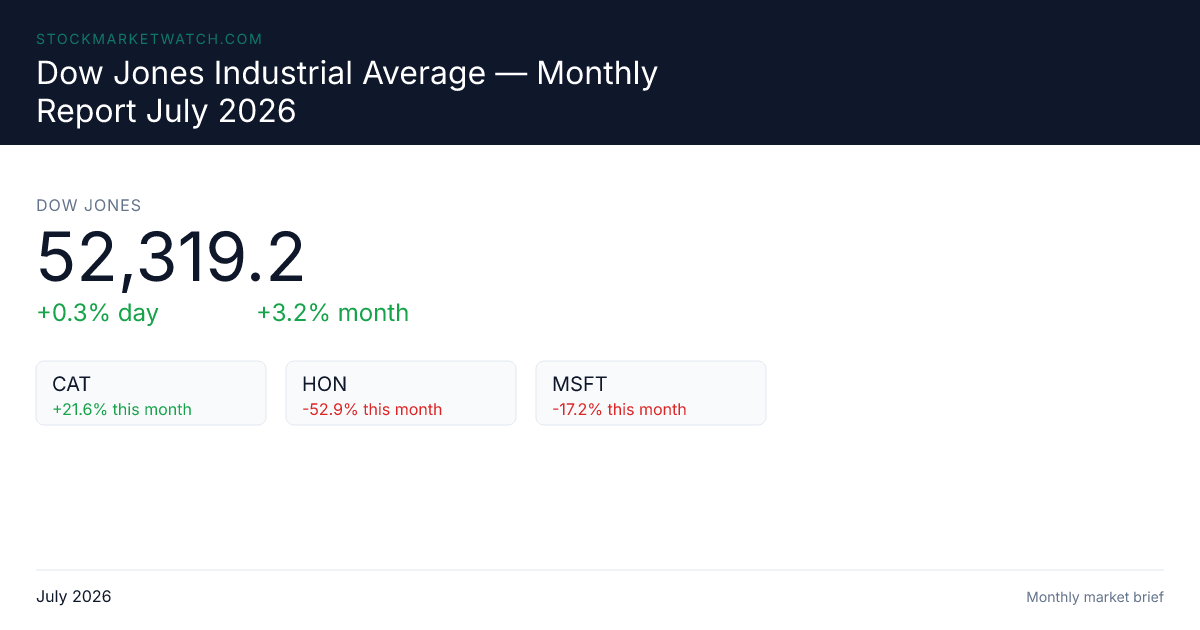
The U.S. equity market as of mid-August 2026 is operating in a sharply bifurcated, catalyst-driven environment where broad index strength masks profound underlying divergence. The S&P 500 has delivered a +14.15% year-to-date return, positioning it among the eight best starts in 33 years of historical data, while the Dow Jones Industrial Average consolidates in a tight $51,500–$54,500 range and the Nasdaq continues to lead on artificial intelligence infrastructure momentum. Yet this headline resilience is heavily concentrated: healthcare, technology, and industrials are capturing disproportionate capital inflows, while adtech, gaming, social platforms, and large-cap media are undergoing structural re-ratings with year-to-date declines exceeding 50%. The market’s forward trajectory hinges on two competing forces: a generational AI capex cycle and clinical breakthroughs in biotech that are fueling bullish sector rotation, versus a persistent geopolitical energy shock stemming from the Strait of Hormuz disruption that is pushing Brent crude above $113/barrel and reintroducing inflation and Fed policy uncertainty. As retail earnings and macroeconomic data releases approach, investors are pivoting from passive index tracking to highly selective, evidence-backed positioning. The environment rewards catalyst-driven conviction over broad market beta, with clear winners and losers emerging along structural rather than cyclical lines.
Market Structure & General Trends
Index Performance & Historical Precedent
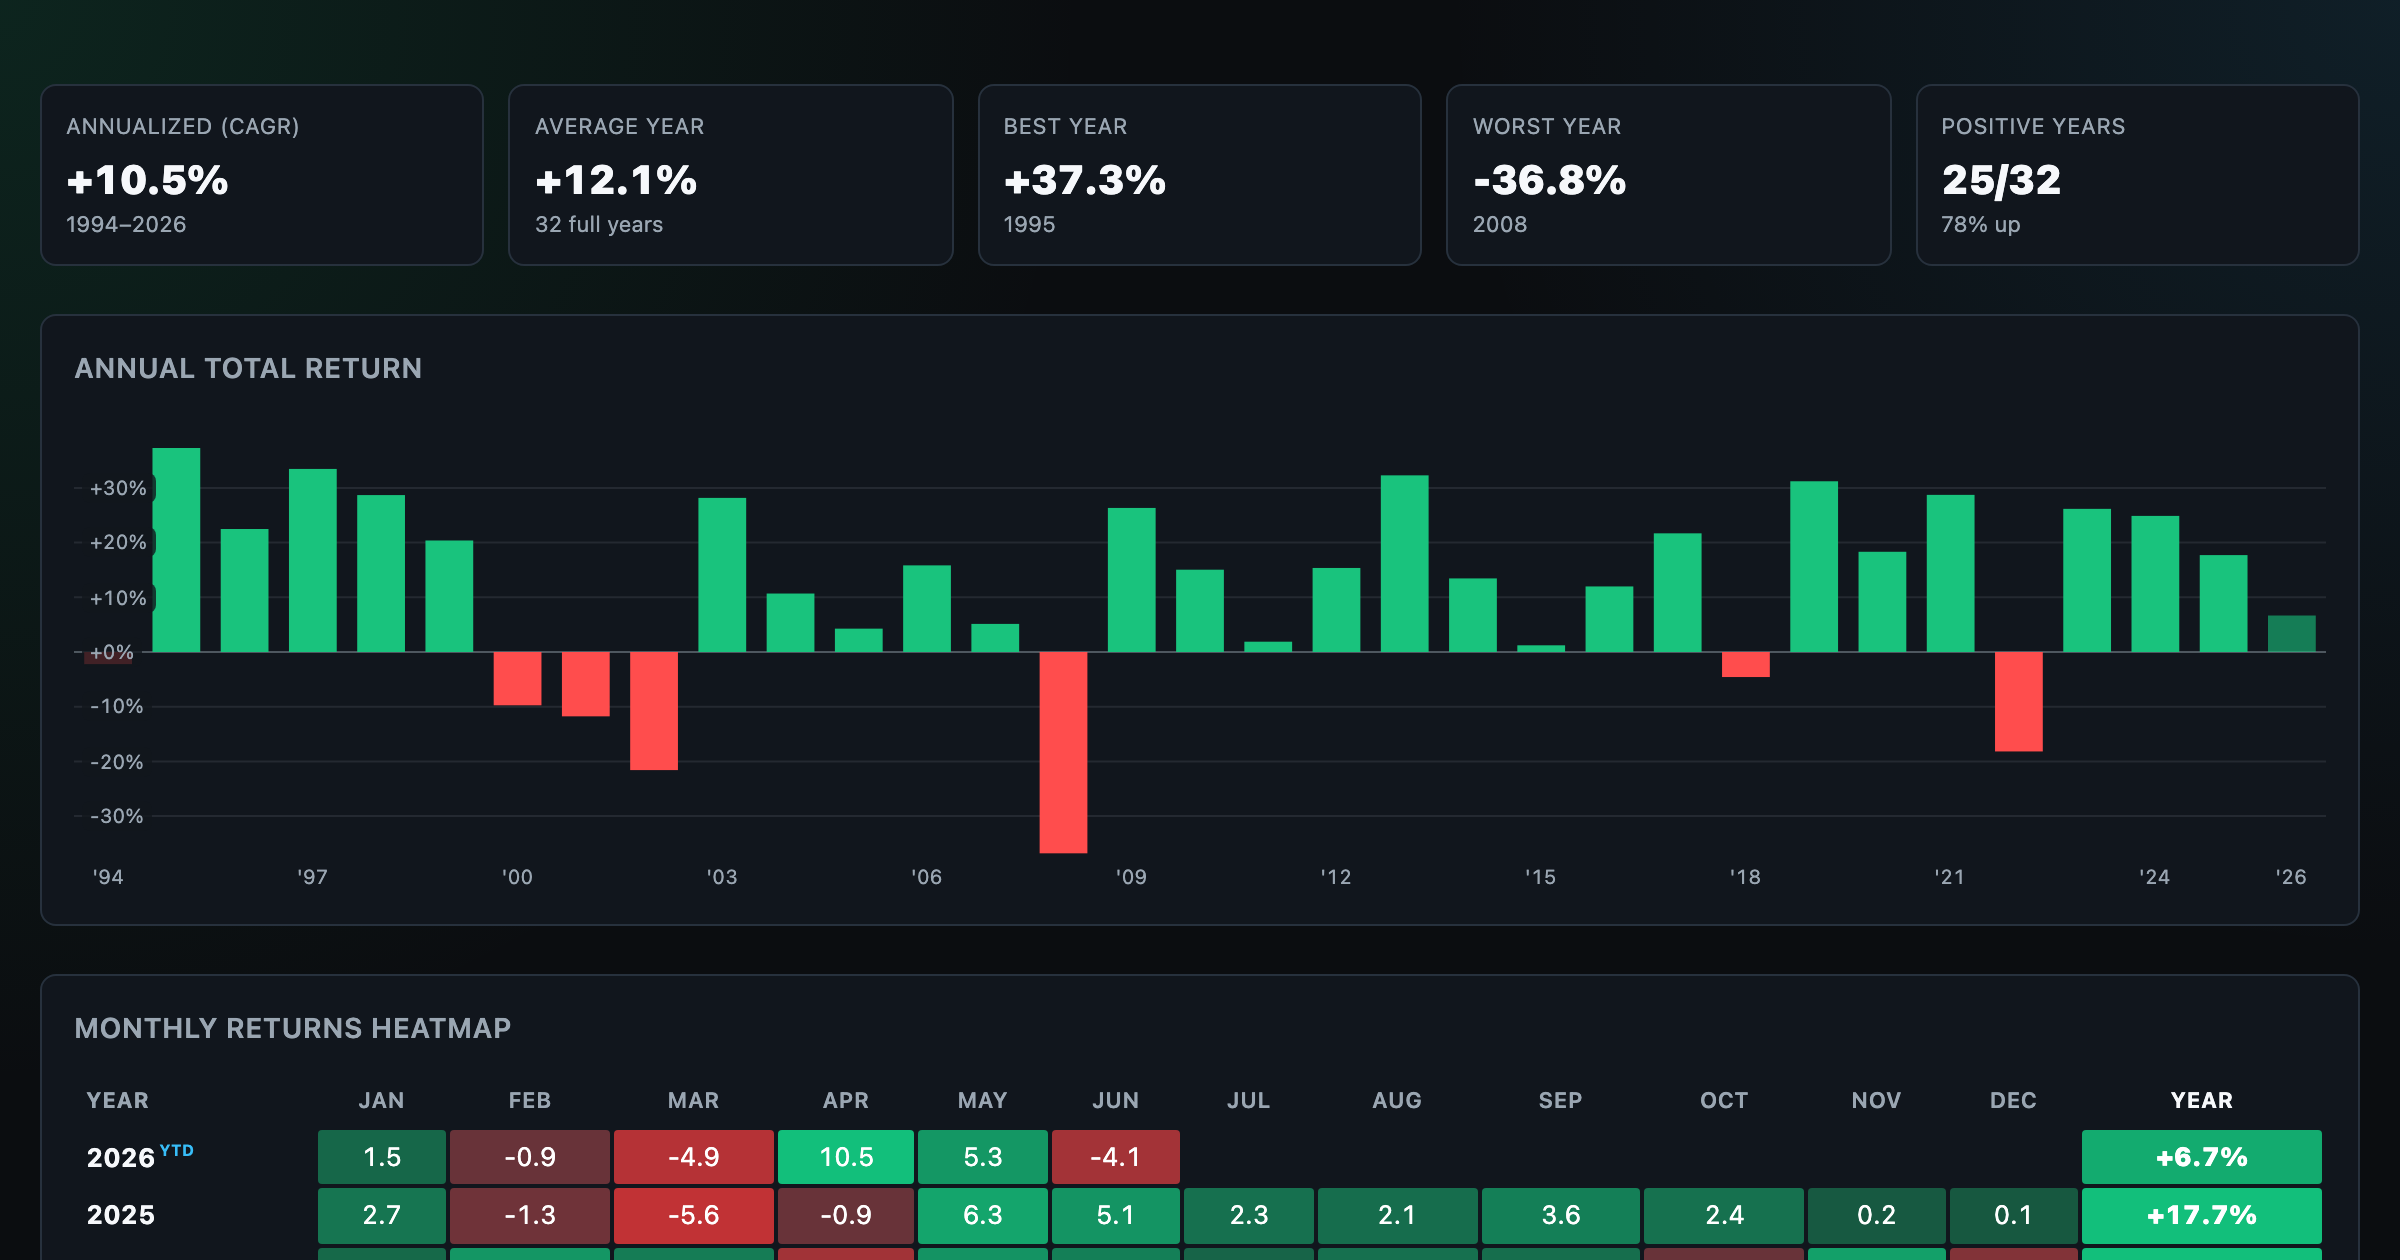
The macro architecture of the U.S. equity market in August 2026 is defined by strong absolute returns layered over pronounced relative divergence. The S&P 500’s +14.15% year-to-date performance through mid-August is not merely a statistical outlier; it sits within a historically reliable pattern. When early-year returns reach this magnitude, subsequent months have historically translated into full-year gains ranging from +15.4% to +31.2%, suggesting that the current pace of appreciation is not a speculative bubble but rather a reflection of sustained corporate profitability and structural capital reallocation [3]. The Nasdaq’s continued leadership underscores the market’s willingness to assign premium valuations to companies embedded in the AI infrastructure stack, while the Dow’s consolidation between $51,500 and $54,500 over the past month reflects institutional caution ahead of critical retail earnings and macro data releases [2][8].
What makes this market structure particularly noteworthy is the active rotation occurring beneath the index surface. Mid-cap S&P 500 constituents have systematically outperformed their large-cap peers, signaling that capital is not merely chasing mega-cap momentum but is actively seeking companies with scalable growth trajectories and improving fundamentals. Conversely, large-cap media companies rank among the worst year-to-date performers, illustrating a decisive capital flight away from ad-dependent, legacy distribution models toward AI-native platforms, biomedical innovators, and industrials benefiting from reshoring and infrastructure spending [2][8]. This rotation is not random; it reflects a market that is pricing in structural economic shifts rather than temporary cyclical noise.
Structural Catalysts & Capital Flows
Several structural catalysts are actively reshaping market dynamics. The upcoming inclusion of Reddit in the S&P 500 represents a significant milestone, as it will trigger mandatory index fund rebalancing and institutionalize demand for a platform that has successfully diversified its revenue model beyond pure advertising [6]. This inclusion also signals that the market’s definition of “tech” continues to expand, now encompassing community-driven data networks alongside traditional software and hardware plays. Simultaneously, the IPO pipeline remains active, with companies like Advasa and Lyntris preparing for public market debuts, indicating that private capital formation is still flowing into niche sectors despite secondary market volatility [6].
The corporate earnings landscape further reinforces the structural thesis. As of late May, 85% of S&P 500 companies had beaten earnings estimates, demonstrating that profitability is not being sacrificed for growth [7]. This earnings momentum provides a fundamental floor for equity valuations, even as macroeconomic headwinds threaten to compress forward multiples. The market is essentially pricing in a scenario where corporate America continues to generate strong cash flows while navigating elevated energy costs and uncertain monetary policy, a delicate balancing act that has so far been managed successfully by companies with pricing power and operational efficiency.
Macro & Geopolitical Backdrop
Beneath the equity market’s resilience lies a macro environment fraught with volatility. The ongoing U.S.-Iran standoff and the subsequent disruption of Strait of Hormuz shipping have fundamentally altered global energy dynamics, pushing Brent crude above $113/barrel and introducing persistent inflationary pressures [10][11]. The World Bank and Dallas Fed have both issued warnings that sustained high crude prices risk reigniting inflation expectations, complicating the Federal Reserve’s rate path and weighing on capital-intensive sectors [6][7][13]. This geopolitical shock is not a transient supply disruption; it is a structural realignment of global oil markets that will likely persist until diplomatic resolutions or alternative energy pathways gain traction [14][15].
Despite these headwinds, the macro backdrop has not derailed the equity rally. The market appears to be pricing in a scenario where energy costs are elevated but manageable, with corporate earnings and AI-driven productivity gains offsetting input cost inflation. However, this assumption carries significant downside risk. Should the Hormuz crisis escalate further or prolong, the resulting inflation spike could force the Fed into a more hawkish stance, compressing valuations across rate-sensitive sectors and triggering a broader risk-off rotation. The interplay between geopolitical energy shocks and monetary policy uncertainty remains the single largest variable threatening the current market structure.
Best & Worst Performing Stocks
The Momentum Leaders
The best-performing stocks since early August reveal a clear thematic alignment with healthcare innovation, AI infrastructure, and software demand. QMCO has emerged as a standout in the technology sector, driven by surging demand for AI-adjacent hardware and data center optimization solutions [5]. VOYG has similarly benefited from this momentum, capturing capital as enterprises accelerate AI deployment across enterprise software stacks [5]. In healthcare, ABCL has delivered explosive returns following the announcement of a strategic partnership with Vertex Pharmaceuticals and the anticipation of upcoming clinical data readouts, highlighting how biomedical catalysts continue to drive outsized stock performance [8][9]. IOVA has also posted strong gains, supported by clinical milestones and robust Q2 2026 earnings activity that validated its pipeline execution [5].
These performers are not random outliers; they represent the market’s highest-conviction bets on structural growth. The common thread among them is the presence of near-term, evidence-backed catalysts that reduce uncertainty and attract institutional capital. When a company can point to a signed partnership, a Phase 3 trial readout, or a clear AI revenue trajectory, the market rewards that clarity with premium valuations and sustained momentum.
The Year-to-Date Decliners
In stark contrast, the worst-performing stocks of 2026 are dominated by adtech, gaming, social platforms, and real estate data companies, with year-to-date declines ranging from -51.9% to -62.8%. TTD has fallen -62.8%, APP has dropped -53.2%, FLUT and RBLX have both declined approximately -52.8%, and CSGP has shed -51.9% [1]. The median year-to-date return for the bottom 50 S&P 500 stocks sits at -34.9%, underscoring that these losses are not isolated incidents but part of a broader sector-wide repricing [1].
The magnitude and consistency of these declines suggest fundamental re-rating rather than temporary volatility. Adtech companies are grappling with a structural shift in digital advertising spend, as brands reallocate budgets toward AI-driven, first-party data strategies that bypass traditional programmatic platforms. Gaming and social platforms face similar headwinds, as user engagement metrics plateau and monetization models struggle to keep pace with rising development costs and regulatory scrutiny. The market is no longer willing to pay speculative multiples for companies whose revenue models are increasingly vulnerable to macroeconomic and technological disruption.
Evidence-Backed Bullish & Bearish Theses

The Bull Case: Healthcare, Tech, and Industrials
The bullish thesis rests on three pillars: generational AI infrastructure spending, biomedical innovation, and industrial cycle recovery. The AI capex cycle is not a speculative bubble but a structural reallocation of capital toward compute, networking, and software that will drive productivity gains across the economy. This is evidenced by the sustained outperformance of QMCO and VOYG, as well as the Nasdaq’s continued leadership [5][7]. Healthcare’s bullish case is equally compelling, with clinical milestones and strategic partnerships like the ABCL-Vertex deal demonstrating that biomedical innovation continues to deliver tangible, revenue-accretive outcomes [8][9]. Industrials benefit from infrastructure spending, manufacturing reshoring, and mid-cap rotation, positioning them as a defensive yet growth-oriented sector [5][8].
Sources largely agree on these bullish drivers. The convergence of earnings momentum (85% beat rate), AI infrastructure demand, and clinical catalysts creates a robust foundation for continued outperformance in these sectors [7]. The only nuance lies in timing: while the long-term thesis is universally accepted, short-term volatility may persist as the market digests retail earnings and macro data releases.
The Bear Case: AdTech, Gaming, and Geopolitical Inflation
The bearish thesis is anchored in structural deterioration within ad-dependent business models and the persistent threat of energy-driven inflation. TTD, APP, FLUT, and RBLX are not merely experiencing cyclical downturns; they are facing fundamental challenges that will likely suppress valuations for years. The >50% YTD declines reflect a market that has priced in the decline of legacy advertising and speculative gaming platforms [1]. Simultaneously, the Strait of Hormuz crisis has introduced a macro bear case that threatens to derail the equity rally. Elevated crude prices are reigniting inflation expectations, complicating Fed policy, and pressuring consumer spending, particularly in discretionary categories [6][7][10].
Where sources diverge is in the severity of the inflation threat. Some analysts view the energy shock as a temporary supply disruption that will be absorbed by corporate pricing power, while others warn that prolonged Hormuz instability could trigger a sustained inflationary environment that forces the Fed into aggressive tightening [11][13][15]. This disagreement introduces meaningful uncertainty into the market’s forward path, particularly for rate-sensitive sectors like real estate and consumer discretionary.
Sector Outlooks: Where Capital Is Heading
Bullish Sector Outlooks
Healthcare, technology, and industrials remain the primary beneficiaries of current capital rotation. Healthcare’s outlook is bolstered by a pipeline of clinical catalysts and strategic partnerships that reduce execution risk and attract institutional capital. The ABCL-Vertex deal and IOVA’s Q2 earnings activity exemplify how evidence-backed biomedical developments continue to drive sector leadership [5][8][9]. Technology’s bullish case is reinforced by the generational AI capex cycle, which is driving sustained demand for hardware, software, and data center infrastructure. The Nasdaq’s YTD leadership and Reddit’s S&P 500 inclusion further validate the sector’s structural strength [5][6][7]. Industrials benefit from a favorable macro backdrop, including infrastructure spending, manufacturing cycle recovery, and mid-cap outperformance, positioning them as a balanced growth and value play [5][8].
Bearish Sector Outlooks
Adtech, gaming, social platforms, and large-cap media face a hostile environment. The >50% YTD declines in TTD, APP, FLUT, and RBLX reflect a market that has structurally repriced ad-dependent and speculative business models [1]. Large-cap media companies are similarly under pressure, as traditional advertising revenue streams are disrupted by AI-driven, first-party data strategies and shifting consumer habits. Consumer discretionary faces macro headwinds from elevated energy costs and uncertain consumer spending, with the upcoming retail earnings season serving as a critical validation point [5][6][8]. Defensive sectors like financials, consumer staples, and healthcare have lagged the AI rally but may offer resilience if market sentiment shifts toward risk-off positioning, though they lack the near-term catalysts driving the current rotation [7].
Fresh News & Forward-Looking Catalysts
The next two weeks will be defined by a concentrated calendar of retail earnings and macroeconomic data releases. Walmart, Home Depot, Lowe’s, and TJX will report in the coming days, providing critical signals on consumer spending trends that will directly impact the consumer discretionary outlook [6]. Economic releases including Housing Starts, the Empire State Manufacturing Index, and PMI will inform the broader macro picture, particularly regarding manufacturing cycle health and inflation expectations [6]. In the energy sector, the EnerCom conference and crude futures expiration will provide fresh catalysts for oil and gas equities, while the ongoing Strait of Hormuz crisis continues to dominate geopolitical analysis [6][10][11].
On the corporate front, Reddit’s S&P 500 inclusion will trigger index fund rebalancing and signal sustained institutional appetite for tech platforms with diversified revenue models [6]. The IPO pipeline remains active, with Advasa and Lyntris preparing for public market debuts, indicating continued capital formation in niche sectors [6]. Industry summits like the Rosenblatt conferences are providing additional catalysts for AI and tech sectors, reinforcing the market’s focus on near-term, evidence-backed growth drivers [6].
Conclusion
The U.S. equity market as of August 2026 is a study in selective strength and structural divergence. The S&P 500’s +14.15% year-to-date return, supported by historical precedents pointing to full-year gains of +15.4% to +31.2%, reflects a market that is fundamentally resilient but highly concentrated [3]. The best performers—QMCO, ABCL, VOYG, and IOVA—are driven by clear catalysts in AI infrastructure and biomedical innovation, while the worst performers—TTD, APP, FLUT, and RBLX—are undergoing structural re-ratings as ad-dependent and speculative business models lose favor [1][5][8]. The bullish case rests on a generational AI capex cycle, clinical breakthroughs, and industrial recovery, while the bear case is anchored in adtech deterioration and the persistent threat of energy-driven inflation from the Strait of Hormuz crisis [7][10][11]. Sources broadly agree on these thematic divides, though they diverge on the severity and duration of the inflation threat [13][15]. As retail earnings and macro data releases approach, the market will pivot from passive index tracking to highly selective, evidence-backed positioning. The environment rewards catalyst-driven conviction, and the winners will be companies that can demonstrate clear revenue trajectories, operational efficiency, and resilience in the face of geopolitical and macroeconomic uncertainty.