

Comprehensive Research Report on Market Structure, Performance, and Sector Outlooks
Executive Summary
As of August 16, 2026, U.S. equity markets are navigating a complex environment defined by robust year-to-date gains, a decisive shift in sector rotation, and a macro backdrop increasingly characterized by stagflationary pressures. While the Russell 2000, Dow Jones, and S&P 500 have all posted solid returns, the underlying structure is no longer one of broad-based participation. Instead, the market is driven by active rotation, with Energy emerging as the dominant best performer and Information Technology and Consumer Discretionary lagging significantly.
The Federal Reserve maintains a hawkish hold with the federal funds rate at 3.50–3.75%, and operational frameworks are explicitly designed to manage ample reserves, signaling no near-term easing. This has triggered a repricing away from rate cuts, driven by surging real yields and term premiums, which creates structural headwinds for duration-sensitive assets. Earnings growth is the strongest since 2021, but aggregate metrics mask extreme divergence; the Energy sector's EPS surge of 61.5% contrasts sharply with Health Care estimates being cut by 15.3%. Meanwhile, the best-performing stocks in absolute terms include highly speculative micro-caps like Optical Cable Corp (OCC) and Faraday Future (FFAI), whose headline percentage gains belie fragile fundamentals and extreme valuation risks. This report synthesizes fresh data to provide a detailed analysis of market structure, earnings, performers, and forward-looking theses.
Market Structure & General Trends

Index Performance and Volatility Contraction
U.S. markets have delivered solid returns year-to-date, though the leadership hierarchy reveals a distinct risk appetite. The Russell 2000 leads with a gain of +23.63%, followed by the Dow Jones Industrial Average at +16.64%, and the S&P 500 at +13.74% [3]. The outperformance of small-cap indices suggests a degree of risk-on sentiment, yet this must be interpreted within the context of low cross-sector correlation. The market is not participating broadly; rather, it is defined by active rotation where capital flows are concentrated in specific themes rather than lifting all boats [1].
Volatility has contracted by 4.68%, indicating improved stability in price action [3]. However, this stability can be misleading. The combination of low volatility and low correlation suggests that while individual assets are not swinging wildly, the portfolio-level risk is elevated due to the lack of diversification benefits. Investors are effectively making concentrated bets on rotation themes rather than holding diversified positions.
The Stagflationary Regime and Federal Reserve Framework
The macro backdrop is shifting into a stagflationary regime, a development with profound implications for asset allocation. The Federal Reserve has maintained a hawkish hold, with the federal funds rate steady at 3.50–3.75% [7]. The Fed's operational framework, as detailed in a July 29, 2026 implementation note, is now explicitly designed to manage ample reserves [8]:
- Standing Overnight Repurchase Agreements (OPR): Set at 3.75%, acting as a ceiling for the federal funds rate.
- Overnight Reverse Repo (ON RRP) Facility: Anchored at 3.50% with a $160 billion per-counterparty daily limit, serving as a floor.
- Reserve Balances: Currently at 3.65%, well within the target range.
- Treasury Bill Purchases: Being deployed to maintain reserve adequacy, with all principal payments from Treasury and agency securities holdings fully rolled over or reinvested [8].
This framework signals a prolonged hold with no near-term easing catalyst. The primary trend is a quiet but powerful repricing away from rate cuts. This is not driven by the policy rate itself but by surging real yields and term premiums [5]. As real yields rise, the real discount rate increases, tightening financial conditions through the cost of capital. This creates a structural headwind for duration-sensitive assets, compressing equity multiples and penalizing growth stocks that rely on distant cash flows.
Fresh macro data highlights divergent growth signals. GDPNow stands at 1.3%, indicating slowing economic momentum, while jobless claims remain soft. This divergence, coupled with rising fiscal dominance risks, suggests that the economy is not expanding robustly enough to justify current equity valuations [5]. Investor focus has pivoted sharply toward forward guidance and balance sheet resilience. Despite robust headline earnings, approximately half of companies that beat expectations still saw stock declines, signaling that past results alone no longer command premiums [2, 6]. The market is demanding proof of capital efficiency and tangible returns on investment, particularly in the context of rising bond yields pressuring the long-end of the curve [1].
Q2 2026 Earnings Landscape
Aggregate Growth and Methodological Divergence
The Q2 2026 earnings season is reporting its strongest growth since 2021, though aggregate metrics vary depending on the analytical methodology employed. FactSet reports a blended earnings growth rate of 37.9% and revenue growth of 13.2% [4]. In contrast, RCK Analytics notes a 24.7% year-over-year blended increase, supported by a 3.4% pre-season analyst revision [7].
This discrepancy between FactSet and RCK highlights a key area of disagreement in the data: different methodologies for weighting and smoothing earnings can lead to significantly different growth narratives. However, both sources agree on the directional trend: earnings are strong, but the growth is highly concentrated. This concentration masks extreme sector divergence and suggests that the "average" company is not experiencing this growth [4, 7].
Sector Divergence: Energy Surge vs. Health Care Decline
The earnings landscape is defined by polarized sector performance:
- Energy: The undisputed top performer, with EPS estimates surging 61.5% [7]. This is underpinned by WTI crude averaging $92.55/barrel and sustained capital discipline among producers [7]. The energy sector's momentum is structural, driven by supply constraints and disciplined capex rather than speculative demand.
- Technology: Gained 8.7% on sustained AI infrastructure capital expenditures [7]. However, this growth is increasingly scrutinized as early reporters like Oracle and Adobe face pressure to demonstrate tangible returns on massive AI capex cycles [4].
- Financials: Thrived on robust net interest margins and renewed capital markets activity, offering a cyclical defensive play [6].
- Health Care: The worst performer, with estimates cut 15.3% due to sharp downward revisions for major pharma names like Merck and Eli Lilly [7]. Despite defensive rotation flows, the sector faces fundamental earnings headwinds.
The Alphabet Skew and Forward Outlooks
A critical nuance in the earnings data is the heavy skew caused by mega-cap concentration. The index's aggregate earnings surprise is heavily influenced by Alphabet's $98 billion gain; excluding Alphabet, the surprise rate normalizes to a more modest 12.6% [4]. This reinforces the theme that market breadth is weak and that a handful of names are driving aggregate metrics.
Forward outlooks remain positive with analysts projecting 27.0–27.3% earnings growth for CY 2026 [4, 7]. However, recent estimate revisions highlight emerging concerns regarding higher oil prices and cautious H2 guidance. The consensus is cautiously optimistic, but the spike in negative EPS revisions for H2 2026 suggests a defensive pivot is warranted. Investors should favor companies with strong balance sheets and reliable cash flows over chasing growth narratives that may falter in a higher-for-longer rate environment [3].
Best & Worst Performers
Index and Sector Performance
Index Performance (Year-to-Date):
- Russell 2000: +23.63%
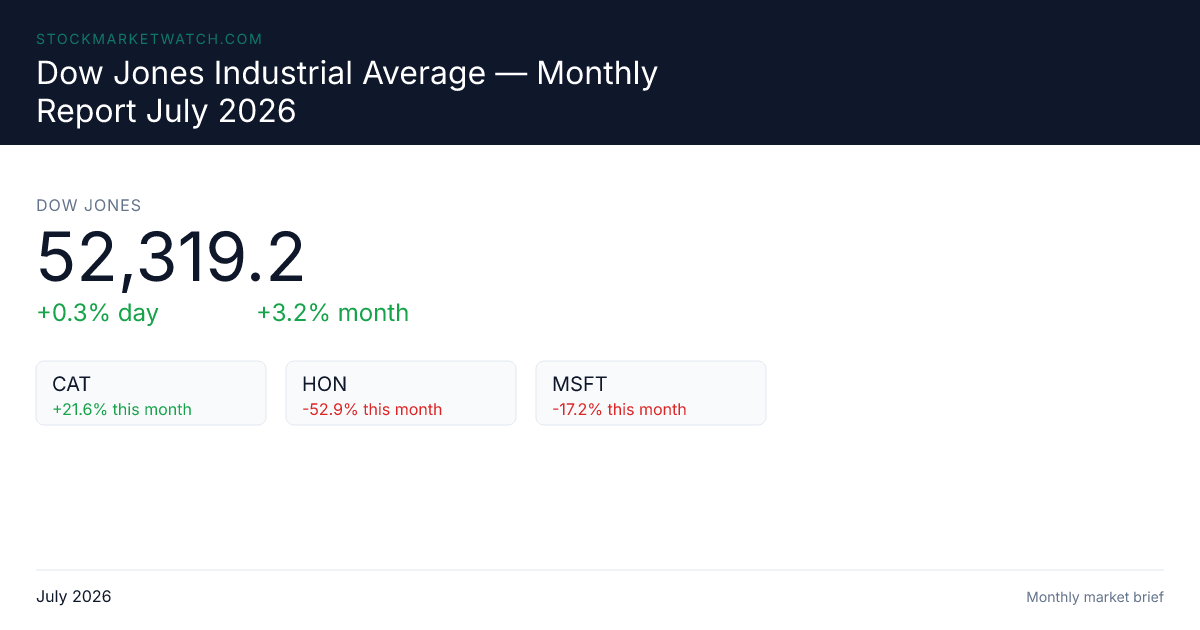
- Dow Jones: +16.64%
- S&P 500: +13.74% [3]
Sector Performance:
- Best: Energy [2, 7]
- Worst: Information Technology, Consumer Discretionary [2]
Top Stock Performers
Optical cable, biotech, and technology hardware stocks dominate the gainers list [3]. The top performers include:
- OCC (Optical Cable Corp): +298.69%
- FFAI (Faraday Future): +297.20%
- DELL: +285.80% [3]
Within the S&P 500, technology hardware leaders including DELL, Seagate (STX), Micron (MU), and Intel (INTC) show strong momentum [3]. This momentum is linked to the data center infrastructure buildout, where constrained supply in optical cables and hardware is providing tangible earnings catalysts.
Micro-Cap Analysis: OCC and FFAI
OCC (Optical Cable Corp) presents a case of massive outperformance counterbalanced by extreme valuation. The stock trades at a P/E ratio greater than 148, with thin profitability, negative free cash flow, and high debt-to-equity ratios [5]. Q2 2026 earnings reinforced the structural tailwind: management reported accelerating backlog growth and surging enterprise/data center demand, supported by persistent supply constraints [10]. However, the fundamental disconnect between speculative price action and underlying cash flow generation remains a key risk. The bullish thesis relies on the continuation of data center buildouts, but the valuation leaves little room for error [10].
FFAI (Faraday Future) offers a cautionary tale of headline percentage gains masking fundamental toxicity. Despite a headline +297% YTD gain, FFAI has declined 99.05% over the trailing 52 weeks, trading at $3.92 with a $7.94 million market cap [9]. The company executed a 1:150 reverse stock split on July 24, 2026, and carries 58.50% short interest [1, 2]. The bullish thesis hinges on a strategic pivot to an embodied AI and robotics ecosystem with early positive margins on robot deliveries. However, fundamentals remain dire: $1.51 million in revenue against $330.63 million in annual operating losses, -$124.80 million in free cash flow, and a toxic balance sheet with $167 million in debt vs. $24.56 million in cash [1, 2, 9, 10]. Single-supplier hardware dependency and intense competitive pressures underscore the peril of chasing headline gains in illiquid segments. Notably, analyst consensus rates the stock a "Strong Buy" with a $48 price target, highlighting a severe disconnect between speculative sentiment and underlying financial reality [9].
Worst Stock Performers
Micro-cap and speculative names suffer near-total losses [3]:
- ADTX: -100%
- HUBC: -99.99% [3]
Within the S&P 500, cybersecurity and software companies face significant headwinds, including CrowdStrike (CRWD), AppLovin (APP), and Intuit (INTU) [3]. Quantitative analysis indicates these decliners cluster below the 40th percentile composite score, pointing to fundamental weakness rather than temporary volatility [3]. The underperformance of software and cyber names suggests that the market is rotating away from high-multiple, unprofitable growth sectors toward tangible infrastructure and value.
Bullish & Bearish Theses
Bullish Theses
- Defensives & AI-Resistant Sectors: Low-beta sectors such as Healthcare and Consumer Staples are favored as investors rotate away from concentrated, flow-driven trades [1]. Sentiment is shifting from AI leaders toward healthcare and staples, providing a defensive haven in a stagflationary environment [2].
- AI Infrastructure & Power: Utilities, Construction, and Industrials are supported by sustained demand for AI-related power and infrastructure [1]. However, investors are increasingly demanding proof of capital efficiency, favoring names with clear monetization paths over speculative capex plays [4].
- International Value: European Tech, Japan, and Emerging Markets (particularly Latin America and EM debt) offer attractive valuations and carry [1]. This provides a diversification play away from overvalued U.S. duration.
- Energy: Remains the structural best performer with strong momentum across all timeframes, underpinned by capital discipline, elevated crude prices, and a 19.4% recent surge [5, 7, 4].
- Financials: Thriving on robust net interest margins and renewed capital markets activity, offering a cyclical defensive play [6].
- Data Center Infrastructure: Optical cable and related hardware names are benefiting from constrained supply and accelerating enterprise/data center buildouts, providing a tangible earnings catalyst for select hardware plays [10].
Bearish Theses
- Stagflation & Real Rates: The market is repricing away from rate cuts as real yields and term premiums surge. This tightens financial conditions through the real discount rate, creating a structural headwind for long-duration assets and equity multiples [5].
- Semiconductors: While specific hardware names are strong, the broader semiconductor sector faces profit-taking pressure after a massive run [1].
- US Equities Broadly: Concentration risks and elevated valuations (20.3x P/E) suggest a tactical reduction in S&P 500 exposure in favor of equally weighted and European indices [1, 7].
- Software & Cyber: Cybersecurity and software companies face fundamental headwinds and underperformance, as evidenced by the worst-performing S&P 500 names [3].
- Consumer Discretionary: Underperformed due to depleted household savings, rising credit delinquencies, and a consumer shift toward trading down, compounded by a GDPNow growth signal of just 1.3% [6, 5].
- Health Care (Fundamental): Despite defensive rotation flows, the sector faces earnings headwinds from sharp downward revisions in major pharma names [7].
- Micro-Cap Speculation: Names like FFAI and OCC exhibit extreme volatility and fragile fundamentals. High short interest, reverse splits, negative free cash flow, and survival concerns underscore the peril of chasing headline percentage gains in illiquid segments [5, 9, 10].
Sector Outlooks
| Outlook | Sectors |
|---|---|
| Bullish | Energy, Financials, Healthcare (defensive rotation), Consumer Staples, Utilities, Industrials, Construction, International (Europe, Japan, EM), Data Center Hardware/Infrastructure |
| Bearish | Information Technology (Software/Cyber focus), Consumer Discretionary, Semiconductors (tactical profit-taking), US Duration, Health Care (fundamental earnings revisions), Micro-Cap Speculative |
Macro Headwinds to Monitor: Rising real yields, term premium expansion, fiscal dominance risks, and divergent growth signals continue to favor cash-flow certainty over growth multiples [5, 7]. The Fed's explicit reserve management framework signals a prolonged hold with no near-term easing catalyst, reinforcing the stagflationary repricing dynamic [8].
Conclusion
The market as of August 16, 2026, is a study in rotation and divergence. While indices show solid YTD gains, the investment landscape is defined by a shift from broad participation to concentrated sector bets. Energy stands out as the structural winner, driven by capital discipline and elevated crude prices, while Information Technology and Consumer Discretionary face headwinds from duration sensitivity and weakening consumer fundamentals.
The macro environment is increasingly stagflationary, with the Fed holding rates steady and real yields repricing equity multiples. This favors defensive sectors like Healthcare and Consumer Staples, as well as tangible infrastructure plays like Utilities and Data Center Hardware. Conversely, software, cyber, and consumer discretionary names are underperforming as the market demands capital efficiency and cash-flow certainty.
Investors must exercise extreme caution regarding headline percentage gains. The top performers include micro-caps like OCC and FFAI, whose massive gains are counterbalanced by toxic fundamentals, extreme valuations, and survival risks. The best strategy in this environment appears to be a defensive pivot toward companies with strong balance sheets, reliable cash flows, and exposure to structural themes like energy supply and AI infrastructure, while reducing exposure to duration-sensitive growth and speculative micro-caps. The data suggests that in Q2 2026, the market rewards quality and value over narrative and speculation.