

Executive Summary
US equity markets extended their rally to fresh all-time highs across the S&P 500, Nasdaq Composite, and Russell 2000 on August 14, 2026, signaling sustained investor confidence despite a macro backdrop defined by complexity and division. The advance was underpinned by in-line inflation data, robust earnings season momentum, and a notable broadening of market participation. However, the rally is occurring against a backdrop of a divided Federal Reserve that held rates steady in July with significant hawkish dissent, while quantitative models now price a 73% probability of a December rate hike [8][9][10].
The market is sending dual signals: headline inflation has cooled to 3.5%, providing a bullish tailwind, but core CPI remains sticky at 2.6%, keeping the Fed's hands tied. A critical intra-week rotation is underway, with momentum shifting from AI/IT hardware dominance toward commodities, logistics, and consumer discretionary, suggesting the market is broadening beyond speculative tech. Key movers include Nebius (+34%) and CoreWeave (+19%) on AI infrastructure optimism, while extreme short-squeeze dynamics drove AKAN to a +90% gain. Conversely, Cerebras (-12%) and select semiconductor names like Cisco (-8%) face headwinds from valuation scrutiny and rising borrowing costs. The September 16 FOMC meeting, with its updated dot plot and economic projections, stands as the critical catalyst that will define the next policy leg.
Market Structure & Macro Backdrop

Index Performance and Momentum Confirmation
The S&P 500, Nasdaq Composite, and Russell 2000 all posted new all-time highs, confirming sustained upward momentum across large-cap, growth, and small-cap segments [1][4][6]. This breadth of advance is significant; historically, when the Russell 2000 participates in new highs alongside the Nasdaq, it suggests a healthy risk appetite extending beyond the "Magnificent Seven" and into the broader economy. The rally is not merely a speculative froth but appears anchored by fundamental earnings momentum and a macro environment where inflation fears are receding at the headline level.
However, the structure of this rally requires careful dissection. While indices are at highs, the composition of gains is shifting. Monthly and daily screeners highlight that commodities are currently outperforming semiconductors, and value-oriented sectors like logistics are gaining relative to speculative growth [3][4][8]. This bifurcation signals that while the market is bullish, it is also rotating into assets that benefit from tangible economic activity and inflation hedges, rather than relying solely on long-duration tech multiples.
The Inflation Paradox: Headline vs. Core
The inflation narrative remains the central tension in the macro backdrop. Headline CPI reversed sharply from 4.2% to 3.5%, a drop that provides a powerful bullish tailwind by reducing immediate recession fears and supporting risk-on positioning [8][9]. This cooling is largely driven by energy price dynamics and base effects, which has emboldened traders to buy the dip on economic data.
Yet, the market cannot afford to ignore core inflation. Core CPI remains elevated at 2.6%, well above the Fed's 2% target [8][9]. This stickiness in core measures suggests that underlying price pressures—driven by services, wages, and housing—are not yet fully resolved. The divergence between headline and core creates a "higher for longer" regime where the Fed can acknowledge headline progress while maintaining a restrictive stance. This dynamic sustains pressure on rate-sensitive assets, as the cost of capital remains elevated for extended periods.
Energy Dynamics and Geopolitical Latency
Oil prices exhibit a dual dynamic that is crucial for sector outlooks. Near-term declines are supporting consumer sectors by lowering input costs, but prices remain elevated above $83 per barrel, and unresolved risks regarding the Strait of Hormuz pose a sharp reversal threat [9][10]. If geopolitical tensions escalate and supply chains are disrupted, the near-term bullish case for consumer discretionary could quickly unravel, reigniting inflation and forcing the Fed's hand. This keeps energy volatility elevated and geopolitics a latent bearish variable that could disrupt the current equilibrium at any moment.
The Divided Federal Reserve and Rate Path
The Federal Reserve's July 29 FOMC decision held rates unchanged but revealed deep committee fractures, with three members dissenting in favor of a rate hike [8][9][11]. This dissent is a rare and potent signal of internal disagreement, indicating that the path forward is not consensus-driven. The "higher for longer" regime is now reinforced by a hawkish dot plot and a transition in Fed leadership, which analysis suggests may lean more conservative on inflation control [5][9].
Prediction markets have incorporated this hawkish tilt. Models now price a 73% probability of a December rate hike, a figure that underscores the market's realization that the Fed may need to tighten further if inflation persists [8][10]. The probability of a hold in September is priced at 69%, but the rate trajectory is tightly coupled to upcoming economic prints. Quantitative models indicate specific thresholds: a cut scenario requires Core CPI <0.2% MoM and Non-Farm Payrolls (NFP) <100K, while a hold or hike scenario hinges on Core PCE >2.5% and NFP >200K [6][13]. This data dependency means that every economic release this week carries outsized weight.
Sector Rotation & Breadth Analysis
The Intra-Week Rotation: From AI to Broadening
A notable intra-week rotation is underway, marking a potential inflection point in market leadership. On August 12, AI and IT hardware surged, driven by strong earnings and agentic AI demand, with the IT sector posting a +1% gain [3][4][8]. However, by August 13–14, momentum shifted decisively toward commodities, logistics, and consumer discretionary [8]. This shift suggests that the market is broadening. While AI remains a structural theme, investors are increasingly seeking value and defensiveness in the face of rising borrowing costs and valuation scrutiny.
Commodities and Logistics Outperformance
The outperformance of commodities versus semiconductors is a key signal. Coffee and tangible assets are leading, signaling a rotation into inflation hedges and value-oriented assets [3][10]. Maersk's +7% gain reflects robust global trade flows, benefiting from the logistics sector's relative strength [4]. This rotation is bullish for the broader economy, as it suggests that capital is flowing into sectors that facilitate physical commerce rather than just digital infrastructure. It also implies that the "soft landing" narrative is gaining traction, as consumers and businesses continue to spend and trade despite higher rates.
AI Bifurcation: Structural Demand vs. Speculative Scrutiny
The AI sector is fracturing. While structural demand for agentic AI hardware remains strong, scrutiny over dependencies on specific providers, rising competition from Chinese open-source models, and rising borrowing costs are creating divergence [3][4][9]. Profitable AI names with clear paths to monetization are outperforming speculative infrastructure plays. This bifurcation is healthy for the sector's long-term development, as it forces capital allocation toward efficiency and profitability rather than pure capex growth.
Best & Worst Stock Performers
Top Performers: AI, M&A, and Short Squeezes
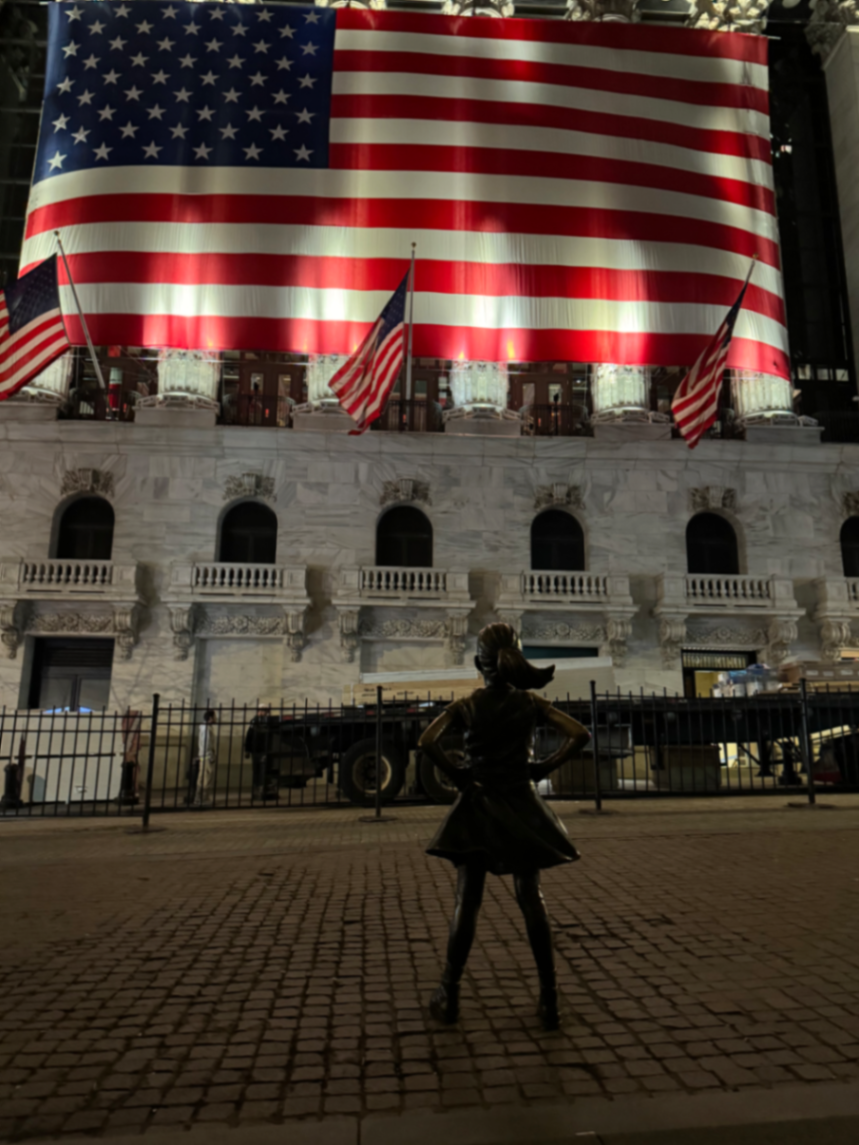
The list of best performers highlights three distinct drivers: AI infrastructure demand, M&A speculation, and extreme short-squeeze dynamics.
- Nebius (+34%): Led the daily gainers, driven by AI infrastructure demand and strong earnings momentum. Nebius's surge confirms that capital expenditure in AI buildout remains robust, with investors rewarding companies that have clear exposure to the agentic AI supply chain [8].
- CoreWeave (+19%) & Super Micro Computer (+19%): These names surged on August 12 amid AI buildout optimism. Their performance underscores the sustained demand for next-generation hardware and cloud infrastructure, validating the bullish thesis on AI capex cycles [8].
- AKAN (+90%): An extreme short-squeeze candidate that led daily gainers. AKAN's +90% gain is driven by high short interest and speculative positioning, highlighting the role of short-squeeze dynamics in creating volatility in smaller-cap names [3][10].
- Workday (+26%): Surged on acquisition talk rumors, underscoring M&A as a volatility driver. Workday's move indicates that consolidation remains a key theme in the enterprise software sector, with strategic acquisitions providing alpha for investors [4].
- Brinker International (+11%) & Birkenstock (+10%): Consumer discretionary and luxury resilience. These performers indicate strength in consumer spending, supported by falling energy costs and stable employment [4].
- Maersk (+7%): Logistics sector outperformance, reflecting robust global trade flows and the rotation into transportation [4].
Bottom Performers: Valuation Headwinds and Rotation Pressure
The worst performers reveal where the market is finding fault, particularly in speculative AI plays and names facing fundamental headwinds.
- Cerebras (-12%): AI infrastructure headwinds and valuation scrutiny. Cerebras's decline reflects the broader bifurcation in the AI sector, where speculative names dependent on specific providers or facing open-source competition are under pressure [4][9].
- National Vision (-6%) & AECOM (-6%): Weak fundamentals and sector-specific rotation pressure. These names fell on poor earnings or guidance, highlighting that rotation is not uniform and that weak companies are being left behind [8].
- Cisco (-8%) & Coherent (-8%): Select semiconductor and networking names underperforming commodities. These declines reflect valuation scrutiny and dependency risks, as investors rotate out of stretched tech multiples into value [4].
- Tapestry (-7%) & Yeti (-4%): Consumer names facing rotation headwinds. Even within consumer discretionary, there is divergence, with luxury and durable goods facing pressure from shifting consumer preferences [4].
Evidence-Backed Bullish & Bearish Theses
Bullish Theses
- AI Hardware & Agentic AI Demand: The surges in CoreWeave, Nebius, and Super Micro confirm sustained capital expenditure in AI infrastructure. Stable buildout cycles and next-generation hardware demand provide structural tailwinds for select IT names. The demand for agentic AI is not a bubble but a fundamental shift in enterprise computing, supporting long-term earnings growth [8].
- Consumer Discretionary & Luxury: Declining near-term oil prices and stable inflation support consumer spending. Performers like Brinker (+11%) and Birkenstock (+10%) indicate strength in this sector. The rotation into consumer names suggests that the economy is resilient, and households are willing to spend on experiences and discretionary goods.
- Commodities & Logistics: Coffee and tangible assets are outperforming semiconductors, signaling a rotation into defensive and value-oriented assets. Maersk (+7%) reflects robust global trade flows. This rotation is bullish for the broader economy, as it indicates that capital is flowing into sectors that benefit from real economic activity.
- Cooling Headline Inflation: The drop in headline CPI to 3.5% reduces immediate recession fears and supports risk-on positioning. While core remains elevated, the headline trend is moving in the right direction, providing a temporary reprieve for rate-sensitive assets.
- M&A Activity: Workday's +26% move underscores the market's appetite for consolidation and strategic acquisitions. M&A activity provides alpha in specific names and suggests that corporate balance sheets remain strong enough to pursue growth through acquisition.
Bearish Theses
- Geopolitical Energy Shock: Strait of Hormuz closure risks and oil prices holding above $83/barrel could reverse near-term declines. A shock would undermine the consumer discretionary bullish case and reignite inflation, forcing the Fed to tighten further. This is the most significant latent risk in the current setup [8][9][10].
- Core Inflation Stickiness & Rate Hike Probability: Core CPI at 2.6% above target, combined with a 73% implied probability of a December hike, suggests the Fed cannot pivot to cuts easily. Prediction markets indicate a hold is the base case for September (69%), but a hike becomes likely if Core PCE remains >2.5% and NFP exceeds 200K. This sustains pressure on high-valuation growth stocks and compresses multiples [6][8][10][13].
- AI Infrastructure Dependencies & Valuation Risk: Cerebras (-12%), Cisco (-8%), and Coherent (-8%) reflect headwinds for AI hardware. Rising borrowing costs and stretched valuations pose structural risks to speculative AI infrastructure plays. The sector is cooling in names dependent on specific providers or facing open-source competition, suggesting that not all AI names will participate in the long-term rally [3][4][9].
- Fed Dissent & Policy Risk: Three FOMC members voted for a hike in July, indicating potential for further tightening if inflation re-accelerates. The "higher for longer" environment increases the cost of capital, which could dampen economic activity and corporate earnings over time [8][9].
- Short Squeeze Volatility: Extreme gainers like AKAN (+90%) indicate elevated short interest and speculative positioning. While these moves can be profitable, they also lead to violent reversals and increased market fragility. A sudden unwind in short positions could create sharp pullbacks in affected names [3][10].
Fresh News & Catalysts
Economic Calendar and Data Dependency
The week of August 10–16, 2026, is anchored by CPI, Retail Sales, PPI, Jobless Claims, and Consumer Sentiment releases. These indicators are the primary market movers and will dictate near-term risk appetite [4][5]. The market is pricing a 69% hold for September, but the path to a December hike depends on data thresholds: a cut requires Core CPI <0.2% MoM and NFP <100K; a hold/hike scenario requires Core PCE >2.5% and NFP >200K [6][13]. Investors should watch these prints closely, as they will validate or challenge the "higher for longer" narrative.
September 16 FOMC Meeting
The September 16 meeting will deliver updated economic projections and the dot plot, serving as the critical catalyst for the next policy leg [8][9][11]. Any shift in the dot plot toward further tightening could spook rate-sensitive assets, while a dovish surprise could fuel a rally. The Fed's leadership transition and hawkish dot plot analysis reinforce the bearish case for rate-sensitive assets, as rising borrowing costs are identified as a key headwind for the AI sector's speculative segment [9].
Source Analysis and Divergence
Sources generally agree on the market's bullish momentum and the importance of the rotation. CNBC and StockTitan align on the top performers (Nebius, CoreWeave, Super Micro) and the bottom performers (Cerebras, National Vision) [4][8]. However, there is a divergence in tone regarding the Fed. While the market's rally suggests confidence in a soft landing, The Motley Fool warns that the probability of a rate hike is soaring, posing a problem for Wall Street [9]. This divergence highlights the tension between market pricing and fundamental risks. Prediction markets and quantitative models provide a more nuanced view, emphasizing data dependency and specific thresholds for rate decisions [6][13].
Conclusion
The market structure on August 14, 2026, is defined by a rally at all-time highs underpinned by cooling headline inflation, robust earnings, and a broadening rotation from speculative tech to commodities and consumer discretionary. The best performers—Nebius, CoreWeave, and Super Micro—reflect sustained AI infrastructure demand, while the worst performers like Cerebras and Cisco highlight valuation scrutiny and sector bifurcation.
However, the bullish case is tempered by significant risks. The divided Federal Reserve, with three dissenters for a hike in July and a 73% probability of a December rate hike, creates a hostile environment for rate-sensitive assets. Core CPI remains sticky at 2.6%, and geopolitical energy risks, particularly around the Strait of Hormuz, pose a latent threat that could reverse the current equilibrium. The rotation into commodities and logistics is a positive sign of market health, but it also suggests that investors are seeking defensiveness in the face of persistent inflation.
The path forward hinges on upcoming data. The economic calendar this week, culminating in the September 16 FOMC meeting, will determine whether the market can sustain its rally or if the "higher for longer" regime will trigger a correction. Investors should remain engaged but cautious, focusing on quality names with clear earnings visibility and avoiding speculative positions that are vulnerable to rising borrowing costs. The market is at a crossroads, and the next leg will be defined by the interplay between inflation data, Fed policy, and geopolitical developments.