
Executive Summary
The U.S. equity market is navigating a decisive consolidation phase as of mid-August 2026, characterized by mixed index performance, compressing volatility, and an active capital rotation away from high-multiple growth names toward sectors with stronger near-term cash flow visibility. The S&P 500 held above 7,700, the VIX declined to 14.55, and the Dow remained nearly flat, painting a picture of institutional caution tempered by underlying buying interest. Top performers are dominated by high-momentum micro and small-cap names across Healthcare, Industrials, and Financial Services, while large-cap technology and rate-sensitive sectors like Real Estate and Consumer Discretionary face persistent headwinds. The evidence points to a market in transition: bullish structural signals (declining volatility, resilient services PMI, broad weekly participation) are counterbalanced by bearish sentiment fragility (tech divergence, manufacturing weakness, and elevated sensitivity to upcoming inflation data). This report synthesizes current market structure, performer rankings, sector outlooks, and evidence-backed theses to provide a comprehensive view of where capital is flowing and why.
Market Structure & General Trends

Index Performance & Volatility Regime
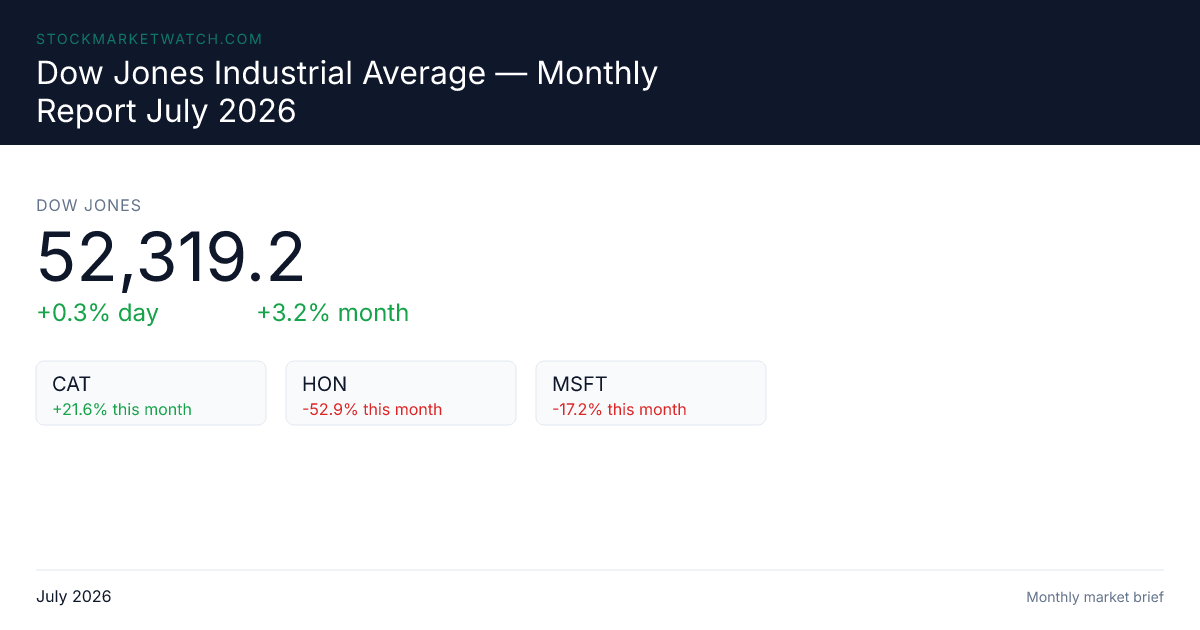
The equity landscape as of August 12–13 reflects a market testing its footing after a period of heightened macro uncertainty. The S&P 500 closed at 7,748.50, posting a modest +0.26% gain, while the NASDAQ advanced +0.54%, signaling that technology and growth stocks retained some directional momentum despite broader mixed signals [8]. The Dow Jones Industrial Average, however, remained nearly flat at 53,770.27, declining just 0.04% (−21.58 points), which underscores a notable divergence between the broader market, growth-oriented tech, and traditional blue-chip industrials [5]. This tripartite split is a hallmark of a maturing market cycle where sector leadership is no longer synchronized but instead driven by idiosyncratic catalysts and macro sensitivity.
Volatility, often considered the market's truest sentiment gauge, has compressed notably. The CBOE Volatility Index (VIX) fell 4.78% to 14.55, a level that historically correlates with reduced institutional fear and increased willingness to hold leveraged or long-duration positions [8, 9]. This compression aligns with the broader weekly trend of declining volatility observed from August 3–7, suggesting that the recent pullback was absorbed rather than amplified by panic selling [8]. When volatility contracts near resistance levels, it typically indicates accumulation rather than distribution, as smart money quietly builds positions ahead of the next directional move. However, this calm is fragile; the VIX's decline also reflects a market that has priced in baseline stability, leaving it vulnerable to sharp reversals if incoming macro data disappoints.
Macro Catalysts & Global Context
The structural backdrop for current market behavior is heavily influenced by central bank policy divergence and a confluence of high-impact macro releases. The Reserve Bank of Australia (RBA) and Bank of England (BoE) recently delivered policy decisions that have reshaped global yield expectations, while cooling Eurozone inflation has indirectly supported risk appetite by reducing the probability of synchronized global tightening [10]. Domestically, the U.S. CPI report remains the primary catalyst driving intraday dynamics, fueling active capital rotation between high-multiple growth and sectors with stronger near-term cash flow visibility [5]. This rotation is not merely a tactical trade; it reflects a structural shift in how institutional allocators are pricing interest rate trajectories and earnings durability.
Global risk appetite remains intact, as evidenced by Asian market strength on August 12. The Nikkei advanced 1.68% and the KOSPI surged 4.31%, indicating that international investors are maintaining exposure to cyclical and growth-oriented assets rather than retreating to safe havens [8]. This global synchronization suggests that the current U.S. consolidation is not a sign of systemic stress but rather a localized recalibration ahead of a dense economic calendar. The week of August 10–14 will be defined by U.S. inflation readings (CPI, PPI), retail sales data, and the RBA rate decision, all of which will likely dictate near-term sector rotation and volatility regimes [10]. Markets are essentially holding their breath, waiting for the next macro inflection point to break the current range.
Best & Worst Stock Performers
The Momentum Leaders
Weekly and monthly screeners for August 2026 reveal a clear bifurcation between high-momentum micro/small-caps and large-cap growth, with top performers spanning multiple sectors. Onfolio Holdings (ONFO) led the 7-day gainer rankings with an extraordinary +3,816.7% gain, followed by NovaBay Pharmaceuticals (NBY) at +2,066.7% [4, 7, 10]. These astronomical returns are characteristic of low-float, high-volatility names that often move on binary catalysts such as clinical trial results, merger announcements, or short-squeeze dynamics. While these gains capture retail and momentum-driven attention, they also highlight the speculative undercurrents within the current market environment.
More broadly, the sector distribution of top performers this month spans Healthcare, Industrials, Financial Services, and Technology, indicating broad-based participation rather than narrow leadership [5]. This multi-sector participation is a healthy structural signal; it suggests that capital is not trapped in a single thematic trade but is instead rotating dynamically across the market in search of relative value. Daily screeners for August 12 further confirm this pattern, with AltIndex data highlighting a diverse cohort of daily gainers across traditional and emerging sectors [9]. The presence of Industrials and Financial Services among the top performers aligns with the broader macro narrative of domestic resilience and stable employment data, reinforcing the idea that the market is rewarding sectors with tangible earnings catalysts over speculative narratives.
The Relative Underperformers
Conversely, the relative underperformers tell a story of capital flight from high-valuation, rate-sensitive, and export-dependent segments. Large-cap technology and high-conviction growth names showed persistent weakness on August 11, consistent with what analysts are terming "tech divergence" [8]. Within the highly watched "Magnificent 7" cohort, performance was highly uneven, with several mega-cap names trailing the broader index [8]. This fragmentation is significant: it indicates that the market no longer treats large-cap tech as a monolithic trade. Instead, capital is being deployed selectively, favoring tech names with fundamental catalysts (earnings beats, product cycles, margin expansion) while abandoning those reliant on multiple expansion and forward guidance.
Broader screeners confirm active capital rotation out of high-PE names into sectors with stronger near-term cash flow visibility [3, 5]. This rotation is not a rejection of growth but a repricing of risk in a higher-for-longer rate environment. When discount rates remain elevated, the present value of distant cash flows compresses, making near-term earnings visibility more valuable than long-term optionality. The divergence between the explosive gains in micro-caps and the stagnation in mega-caps underscores a market that is increasingly bifurcated: speculative momentum thrives in the small-cap space, while institutional capital seeks defensive certainty in value and quality segments.
Sector Outlooks: Bullish vs. Bearish
The Bullish Case: Defensive & Domestic-Focused Sectors
The bullish sector outlook centers on Energy, Utilities, Industrials, Services, and domestically oriented segments. Capital rotation is actively favoring these areas due to their tangible earnings catalysts, defensive characteristics, and exposure to resilient domestic demand [16]. Services and domestically oriented sectors are particularly well-positioned, benefiting from stable employment data and divergent PMI readings that favor non-manufacturing activity over industrial output. When the manufacturing PMI lags but the services PMI holds firm, it signals an economy that is shifting from capital-intensive production to consumption and labor-driven growth. This structural shift directly benefits healthcare providers, financial services, and business-to-business services, which are less exposed to global supply chain disruptions and trade deficits.
Furthermore, consolidation near the 7,750 level often precedes continuation moves if macro data remains stable, favoring sectors with stronger near-term cash flow visibility [8]. Energy and Utilities, traditionally viewed as defensive plays, have also benefited from this environment. Energy benefits from supply discipline and geopolitical premiums, while Utilities offer yield stability in a rate-sensitive landscape. The bullish case for these sectors is reinforced by declining volatility and broad-based weekly gains in the prior session, which together indicate underlying buying interest in domestic and cyclical sectors [8, 9, 17]. Institutional allocators are effectively positioning for a "soft landing" scenario where growth moderates but does not collapse, allowing defensive and domestically focused sectors to outperform.
The Bearish Case: Rate-Sensitive & Export-Oriented Sectors
The bearish sector outlook is concentrated in Real Estate, Communication Services, Consumer Discretionary, and manufacturing/export-oriented segments. Real estate faces structural headwinds from elevated rate sensitivity, as higher borrowing costs directly compress cap rates and reduce property valuations [16]. Communication Services and Consumer Discretionary are similarly pressured by weakening consumer demand, as elevated prices and persistent inflation erode discretionary spending power. When retail sales data disappoints, these sectors are typically the first to reflect the pullback, as consumers prioritize essentials over luxury and entertainment.
Manufacturing and export-oriented sectors are additionally pressured by weak industrial production and persistent trade deficits, which suggest that global demand for U.S. goods is softening [5]. The tech divergence observed on August 11 further signals near-term fragility in mega-cap growth, particularly for companies reliant on long-duration cash flows and speculative multiple expansion [8]. If earnings catalysts or macro liquidity conditions fail to materialize, high-valuation sectors remain vulnerable to sentiment-driven pullbacks. The bearish case is not a prediction of systemic decline but a warning that sectors lacking near-term earnings visibility or exposed to rate sensitivity will continue to underperform until the macro environment provides clearer direction.
The Technology Nuance
It is critical to note that technology is not uniformly bearish. While high-multiple growth faces headwinds, technology remains represented among top performers, suggesting selective strength in tech names with fundamental catalysts rather than broad-based enthusiasm for the sector [5]. This nuance is often overlooked in simplified sector analyses. The market is effectively rewarding tech companies that can demonstrate margin expansion, AI-driven productivity gains, or clear monetization pathways, while penalizing those reliant on narrative-driven valuations. This selective strength indicates that technology's outlook is conditional, not directional, and will likely remain bifurcated until earnings season provides clearer confirmation.
Evidence-Backed Theses
The Bullish Thesis: Accumulation Over Distribution
The bullish thesis is built on a confluence of structural and sentiment indicators that point to underlying market strength. The S&P 500's rapid recovery from the August 11 pullback, combined with its firm hold above 7,700 and the VIX compressing to 14.55, supports a short-term bullish structure [8, 9]. Consolidation patterns at current levels typically reflect accumulation rather than distribution, as institutional buyers absorb supply ahead of the next catalyst. Declining volatility, broad-based weekly gains in the prior session, strength in Asian markets, and resilient services PMI readings all reinforce underlying buying interest in domestic and cyclical sectors [8, 9, 17].
Moreover, the rotation into defensive and domestically focused sectors is not a sign of capitulation but a strategic reallocation that preserves capital while maintaining upside exposure. When the VIX compresses near 15, it historically precedes periods of sustained equity outperformance, as reduced fear encourages leveraged positioning and risk-on flows. The bullish thesis holds as long as upcoming CPI, PPI, and retail sales data remain within baseline expectations, allowing the market to maintain its consolidation-to-breakout trajectory.
The Bearish Thesis: Sentiment Fragility & Rotation Risk
The bearish thesis, conversely, emphasizes the fragility of the current equilibrium. Tech divergence and the August 11 slip highlight vulnerability to sentiment shifts, particularly in an environment where macro sensitivity is elevated [8]. The Dow's stagnation (-0.04%) and the CPI-driven rotation suggest that the market is highly responsive to inflation data, leaving it vulnerable to sharp reversals if readings disappoint [5]. Manufacturing and export-oriented sectors face headwinds from weak industrial production and trade deficits, while real estate and consumer discretionary remain rate-sensitive [16].
If technology fails to re-lead, broader indices may struggle to break above the August 10 high of 7,753.11, potentially triggering a range-bound or corrective phase as rotation accelerates out of high-PE names [8, 9, 10]. The bearish thesis does not predict a crash but rather a prolonged period of choppy, sector-rotational trading where directional clarity is absent. Upcoming CPI, PPI, and retail sales data will be the primary catalysts for either breakout or breakdown, and any deviation from baseline expectations could amplify volatility and force a re-pricing of risk [17].
Source Alignment & Divergence
Across the provided evidence, sources largely agree on the rotation theme, the compressing volatility regime, and the macro-driven nature of current market dynamics. However, there is notable divergence on whether the current consolidation represents accumulation (bullish) or distribution (bearish). Some screeners and economic calendars emphasize broad participation and declining VIX as signs of healthy buildup [8, 9, 17], while others highlight tech divergence and manufacturing weakness as warning signs of underlying fragility [3, 5, 8]. This disagreement is inherent to market analysis and reflects the tension between structural strength and sentiment vulnerability. The evidence does not conclusively favor one side but instead underscores the importance of upcoming macro data in breaking the current equilibrium.
Data Limitations & Source Synthesis
It is important to acknowledge the limitations inherent in the collected evidence. Sector performance data is backward-looking (prior-day) and does not constitute forward-looking guidance [16]. Granular stock lists, sector ETF breakdowns, and macro catalysts are not fully populated in all extracted text, meaning some analyses rely on aggregated or truncated data [10, 17]. Additionally, the provided extracts include structural dashboards, truncated recaps, screeners, and economic calendars, which vary in methodology and timeframes [1, 4, 6, 11]. While these sources collectively paint a coherent picture of market structure, they should be interpreted as complementary rather than definitive. All theses and outlooks are synthesized strictly from available data points and should be treated as informational rather than prescriptive.
Conclusion
The U.S. equity market as of August 13, 2026, is in a consolidation phase shaped by compressing volatility, active capital rotation, and heightened sensitivity to upcoming macro data. The evidence supports a cautiously bullish structural backdrop: the VIX's decline to 14.55, the S&P 500's hold above 7,700, and broad-based participation across Healthcare, Industrials, and Financial Services all indicate underlying buying interest. However, this optimism is counterbalanced by clear bearish headwinds: tech divergence, rate-sensitive sector weakness, and the fragility of high-valuation names in a macro environment that rewards near-term cash flow visibility. The best performers are dominated by high-momentum small-caps and domestically focused sectors, while the worst performers cluster in Real Estate, Consumer Discretionary, and export-oriented manufacturing.
Ultimately, the market is not trending but rotating. The evidence-backed theses suggest that bulls are correct about accumulation and structural resilience, while bears are correct about sentiment fragility and macro dependency. The path forward will be dictated by upcoming CPI, PPI, and retail sales data, which will either validate the consolidation-to-breakout narrative or trigger a corrective phase. For investors, the optimal stance is not directional but adaptive: favoring sectors with tangible earnings catalysts, maintaining exposure to defensive and domestically focused segments, and remaining prepared for rapid rotation as macro data shifts the risk-reward landscape. The market signal is clear: stability is conditional, leadership is fragmented, and the next macro inflection point will determine whether consolidation becomes continuation or correction.