

Executive Summary
As of August 10, 2026, the U.S. equity landscape presents a paradox of historic milestones and profound structural inversions. The S&P 500 has reclaimed a record high, while the Dow Jones Industrial Average has surged past the psychological milestone of 54,000, underscoring a cycle defined by resilient corporate earnings and a labor market that continues to defy recessionary expectations CNN. However, beneath these headline numbers lies a dual momentum regime that demands nuanced interpretation. While annual leadership remains firmly in Technology and Small Caps, the year-to-date (YTD) rotation has decisively shifted toward cyclicals, commodities, and infrastructure-related sectors.
The market structure is currently characterized by a "sector inversion" from historical norms. Energy and Materials are leading YTD performance, driven by sustained capital deployment into AI infrastructure and commodity demand, while traditionally defensive sectors like Healthcare and Financials have significantly underperformed. This divergence signals that markets are pricing in prolonged economic expansion and real-asset strength rather than defensive positioning. A robust July Jobs Report has reinforced the "soft landing" narrative, and the monetary environment remains supportive, with the federal funds rate holding at 3.63% and real yields contracting Federal Reserve Board. Yet, near-term risks persist, including a stark divergence between YTD commodity strength and YTD consumer weakness, seasonal headwinds, and the speculative volatility evident in today's top gainers. This report synthesizes these dynamics, offering evidence-backed bullish and bearish theses, sector outlooks, and a comprehensive analysis of market performers.
Market Structure & Index Performance

The current market structure is defined by a compelling divergence between trailing twelve-month performance and calendar-year returns, revealing the true composition of the rally.
Index Milestones and Divergence
| Index | Daily Change (Thu 8/6) | Weekly Gain | Yearly Gain | YTD / Annual Context |
|---|---|---|---|---|
| S&P 500 | -0.2% | +2.9% | +12.6% | ~12–15% YTD; back at record high |
| Dow Jones | -0.9% | +2.7% | +12.1% | Surpassed 54,000 milestone |
| Nasdaq Composite | -0.1% | +3.8% | +13.4% | +25.65% annually; Tech leadership |
| Russell 2000 | -0.6% | +2.4% | +20.9% | Outperforming large caps yearly |
Data synthesized from AP News AP News, Country Economy Country Economy, and Stock Market Watch Stock Market Watch.
The S&P 500's return to an all-time high and the Dow's crossing of 54,000 reflect broad-based confidence supported by the resilient labor market AP News. However, the Nasdaq Composite tells a more complex story. On an annual basis, the Nasdaq leads with a staggering +25.65% gain, driven by sustained AI and cloud momentum. Yet, YTD returns for the Technology sector have moderated to approximately +7.33%. This gap suggests the tech rally is heavily weighted toward trailing performance (including strong 2025 gains) rather than calendar-year expansion, indicating a potential mean-reversion dynamic in 2026.
Simultaneously, the Russell 2000 has delivered a +20.9% yearly gain, significantly outperforming large-cap indices. This small-cap outperformance is a hallmark of healthy market breadth and domestic economic vitality, often signaling a late-cycle or broad-participation characteristic that supports the sustainability of the bull market.
Sector Inversion
The most notable structural shift is the inversion of sector leadership. YTD data shows Energy (+23.19%) and Materials (+12.75%) as the structural leaders, while defensive sectors like Healthcare (-5.78%) and Financials (-4.3%) have lagged. This signals that markets are pricing in sustained economic expansion, commodity demand, and infrastructure spending rather than recession fears. The rotation away from defensives and into cyclicals validates the "soft landing" thesis and highlights the dominance of real assets in the current cycle.
Monetary & Rate Environment
The monetary backdrop remains a critical pillar supporting equity valuations. According to the Federal Reserve's H.15 report, the short-term funding environment is stable, with the federal funds rate holding at 3.63% and the bank prime rate at 6.75% Federal Reserve Board.
Treasury yields across the curve have trended slightly lower, with the 10-year yield declining to 4.69% and real (inflation-indexed) yields contracting. This yield profile suggests the market is pricing in easing inflation expectations or potential future rate cuts. The decline in real yields is particularly supportive for equity risk premiums, as it reduces the discount rate applied to future earnings, favoring growth-oriented sectors. However, the 10-year yield remains elevated relative to the early 2020s, which continues to pressure rate-sensitive fixed-income returns and compress net interest margins for financial institutions.
Top & Bottom Performers
Today's session showcased extreme volatility in individual stock performance, with the top-gainer list dominated by high-beta, earnings-driven movers.
Best Performers
The average gain across the top 100 gainers list was +11.62%, with prices ranging from $5.01 to $571.01. The standout performers include:
- Samsung Electronics (SSNLF/KRX): +114.69% — Dominated the top-gainer list, likely driven by a major earnings beat, analyst upgrade, or sector-specific catalyst.
- Quinstreet (QNST): +38.50% — High-beta movement consistent with earnings surprises or favorable contract announcements.
- Atlassian (TEAM): +35.31% — Surged on better-than-expected quarterly earnings, demonstrating that selective fundamental catalysts can drive outperformance even during broad market consolidation WeeklyTrader.io.
- Doximity (DOCS): +6.7% — Continued upside following positive guidance or sector momentum.
Note: The concentration of top gainers in high-beta, single-day spikes carries elevated reversal risk and may distort sector rotation signals if sustained capital does not follow.
Worst Performers
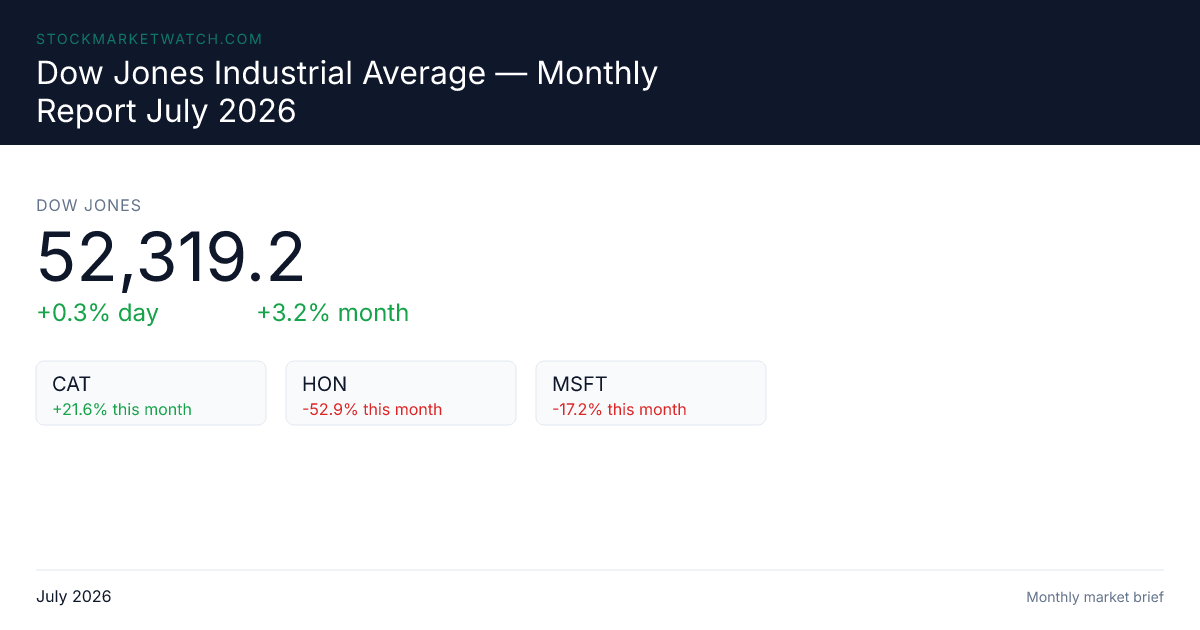
Granular daily losers for this session were not numerically extracted in the current source set, creating a data asymmetry in the evidence base. However, industrial and aerospace names, such as Honeywell Aerospace (HON), have shown vulnerability to demand normalization and guidance revisions in recent sessions Stock Market Watch. Market dashboards and sector-specific screens remain the primary source for real-time decliner data WallStreetZen.
Evidence-Backed Bullish & Bearish Theses
🟢 Bullish Thesis
- Macro Resilience & Soft Landing: A robust July Jobs Report indicated a resilient labor market, fueling investor confidence that the U.S. economy can avoid a hard landing. This narrative supports equity valuations and reduces recession fears AP News.
- AI Demand & Infrastructure Supercycle: Sustained institutional appetite for AI, cloud, and digital ecosystem exposure continues to drive the Nasdaq (+25.65% annually). YTD leadership in Materials (+12.75%) and Energy (+23.19%) reflects massive capital deployment into AI infrastructure, data centers, and energy grids, validating the "picks and shovels" investment theme.
- Commodity & Cyclical Strength: The inversion of sector performance—where Energy and Materials lead—suggests a structural shift toward real assets. Bullish theses center on sustained commodity demand, infrastructure spending, and a rotation away from high-valuation growth stocks toward earnings-backed cyclicals.
- Small-Cap Breadth: The Russell 2000's +20.9% yearly gain and outperformance versus large caps imply healthy market breadth and domestic economic vitality.
- Consumer Discretionary Bounce: Despite YTD weakness, Consumer Discretionary was the top sector today (+1.49%), suggesting that declining oil prices and strong employment data are beginning to support consumer margins and discretionary spending.
🔴 Bearish Thesis
- Consumer Collapse & Sector Divergence: YTD data shows a near-total collapse in Consumer Discretionary and Communications returns (near 0%). This divergence between commodity strength and consumer weakness suggests weakening consumer confidence and potential demand destruction at the retail level, even as industrial demand remains robust.
- Tech Mean Reversion: Technology's YTD return of +7.33% lags significantly behind its annual +25.65% performance. Rising Treasury yields and mean-reversion pressures may compress growth multiples in the near term, despite strong earnings.
- Seasonal Weakness & Inflation: Historical seasonal patterns suggest potential headwinds in late summer/early autumn. Lingering inflationary pressures, particularly in energy and materials, could force the Fed into a more hawkish stance, compressing equity multiples.
- Geopolitical Fragmentation: Cross-border capital flows and geopolitical risks may fragment global risk appetite. The strong YTD performance of Energy and Materials may also reflect a "war premium" or supply-chain hedging that could reverse if tensions ease.
- Energy Volatility: While Energy is a YTD leader, today's -1.13% decline follows reported Brent crude volatility (+4% on 8/6). Isolated surges create margin pressure and raise input costs for energy-sensitive sectors, introducing whipsaw risk for momentum traders.
- Speculative & Short-Squeeze Risk: The top-gainer list is heavily weighted toward high-beta, single-day spikes. While driven by fundamentals, such moves carry elevated reversal risk and may distort sector rotation signals.
Sector Outlooks

| Sector | YTD Performance | Today (8/10) | Outlook | Rationale |
|---|---|---|---|---|
| Technology | +7.33% | +1.42% | 🟢 Bullish (Annual) / 🟡 Neutral (YTD) | Nasdaq leads annually (+25.65%) and weekly (+5.19%). YTD moderation suggests mean reversion; rotation risk if yields rise. Stable short-term rates and declining real yields provide a supportive backdrop for growth multiples. |
| Energy | +23.19% | -1.13% | 🟡 Mixed (Near-Term Pullback) | YTD leader driven by commodity rallies and AI infra demand. Today's decline and Brent volatility signal profit-taking and margin pressure. |
| Materials | +12.75% | +1.32% | 🟢 Bullish | Strong YTD performance supported by AI infrastructure capex and commodity demand. Today's outperformance confirms sustained institutional interest. |
| Consumer Discretionary | ~0% | +1.49% | 🟡 Mixed (Rebound Risk) | YTD collapse suggests structural consumer weakness, but today's leadership indicates a potential tactical bounce as oil prices decline. |
| Small Caps / Industrials | +20.9% (Russell) | N/A | 🟢 Bullish | Russell 2000 outperforming large caps yearly. Infrastructure spending and domestic economic expansion support small-cap earnings. |
| Financials | -4.3% | -0.36% | 🔴 Bearish | Significant YTD underperformance. Rising Treasury yields compress net interest margins; mixed RRG signals suggest capital outflows. |
| Healthcare | -5.78% | N/A | 🔴 Bearish | Worst-performing sector YTD. Defensive rotation has reversed; growth/tech and cyclicals are draining capital from healthcare. |
| Fixed Income / Macro | N/A | N/A | 🟢 Supportive | Fed funds at 3.63%, prime at 6.75%, 10Y at 4.69% with contracting real yields. The rate environment remains favorable for equity risk premiums and growth sectors. |
Sector data synthesized from TrendFigures TrendFigures, ETF Sector Data ETF Sector Data, and Westmount Fundamentals Westmount Fundamentals.
Sector Rotation Signals (RRG Analysis)
Relative Rotation Graphs indicate mixed market sentiment with capital shifting between sectors based on economic cycles. The current environment shows Growth and Cyclicals leading in momentum, while Defensive sectors lag, consistent with a late-expansion or "goldilocks" risk appetite. However, RRG quadrants suggest some sectors are losing directional strength, warning of potential reversals if macro data disappoints TradewithMaya.
Key Risks & Forward Look
- Consumer vs. Industrial Divergence: The stark contrast between YTD Energy/Materials strength and Consumer Discretionary collapse is a fragile structure. If consumer demand continues to weaken, industrial earnings could face downstream headwinds.
- Oil Volatility: A sustained Brent crude uptrend could reignite inflation expectations and force the Fed into a more hawkish stance. Today's Energy decline may be a temporary pullback; monitoring Brent for sustained direction is critical.
- Yield Curve Dynamics: The 10-year yield's decline to 4.69% and contracting real yields provide near-term support for growth stocks, but any reversal toward higher term premiums could compress equity multiples. The Tech YTD moderation (+7.33%) may be a leading indicator of this dynamic.
- Earnings Season Continuation: Q2/Q3 guidance will be pivotal. Broad beats sustain the bull case; widespread misses could trigger a technical correction.
- Global Fragmentation: European market weakness and cross-border capital flows may limit U.S. equity outperformance if geopolitical or trade tensions escalate.
- Speculative Volatility: The concentration of top gainers in high-beta, single-day movers introduces short-term noise. Traders should distinguish between fundamental catalysts and speculative squeezes when positioning for sector rotations.
Conclusion
The market structure as of August 10, 2026, reflects a complex interplay of historic highs and structural rotations. The bullish case is anchored by macro resilience, a soft-landing narrative reinforced by strong employment data, and a supercycle of AI-driven infrastructure demand that has elevated Energy and Materials to YTD leadership. The monetary environment, with stable short-term rates and contracting real yields, continues to support equity risk premiums. Small-cap outperformance and broad market breadth further validate the sustainability of the rally.
However, the bearish risks are equally compelling. The near-total collapse in Consumer Discretionary YTD returns signals potential demand destruction that could undermine the industrial strength currently driving the market. Technology faces mean-reversion pressures as YTD returns lag annual performance, and seasonal headwinds, oil volatility, and geopolitical fragmentation introduce near-term uncertainty. The inversion of sector leadership—where defensives lag and cyclicals lead—suggests the market is pricing in a specific economic outcome; any deviation from this narrative could trigger sharp rotations.
In summary, the market is at a critical juncture. The dual momentum regime demands a balanced approach: maintaining exposure to the structural winners in Technology and Small Caps on an annual basis, while acknowledging the YTD dominance of cyclicals and commodities. Investors should monitor the consumer-Industrial divergence, oil price direction, and yield curve dynamics as the primary indicators of whether the soft-landing narrative can hold or if a more defensive posture is warranted. The evidence suggests that while the bull case remains intact, the path forward is fraught with selective rotation risks and the potential for volatility as the market digests the implications of a resilient yet fragile economy.