

Edition Date: August 8, 2026 | Channel: Market Signal | Run Type: Scheduled Daily Edition
Executive Summary
The U.S. equity market as of August 8, 2026, presents a complex narrative of bifurcation. While the market exhibits signs of a broadening rally, with the Russell 2000 leading year-to-date returns at +20.44%, this outperformance occurs against a backdrop of extreme mega-cap concentration in AI infrastructure and divergent signals between equity performance and credit markets. The Nasdaq 100 (+15.25%), S&P 500 (+12.08%), and Dow Jones (+11.69%) continue to trail small-caps, suggesting capital is rotating toward rate-sensitive domestic cyclicals, likely anticipating Federal Reserve easing. However, this rotation coexists with a structural dominance where Information Technology captures nearly half of the Top 100 companies' combined market capitalization, with NVIDIA alone commanding a valuation of $4.7 trillion to $4.85 trillion.
Performance is sharply polarized. On one hand, high-conviction S&P 500 leaders like Sandisk (+396.1%), Dell Technologies (+256.64%), and Micron Technology are surging on validated AI hardware demand. On the other, speculative outliers like Elox Medical (>1,500,000%) and Mega Fortune Co. (+1,217%) reflect mania-like characteristics in smaller names. Meanwhile, traditional sectors such as Energy and Industrials face structural headwinds, trading at compressed multiples as capital flows toward AI-adjacent platforms. The coming week features critical inflection points, including semiconductor earnings from TSMC, NVIDIA, and AMD, and a Federal Open Market Committee meeting where derivatives imply a 62% probability of a hold and a 36% probability of a hike, contradicting the rate-cut expectations priced into small-cap outperformance.
1. Market Structure & General Trends
The Dual Dynamics of Concentration and Rotation
The current market structure is defined by two coexisting, seemingly contradictory dynamics: extreme concentration in AI infrastructure and a broadening rotation into small-cap and cyclical equities. The Russell 2000's +20.44% year-to-date gain significantly outpaces the Nasdaq 100 (+15.25%), S&P 500 (+12.08%), and Dow Jones (+11.69%) [Source: https://stockanalysis.com/markets/gainers/ytd/]. This small-cap leadership is a critical structural signal. It indicates that capital is rotating toward rate-sensitive and domestic cyclical stocks, likely pricing in improved demand conditions and potential Federal Reserve easing. This rotation reduces the market's reliance on mega-cap concentration for absolute index returns, a healthy development for market breadth. However, this broadening must be viewed alongside the persistent dominance of mega-cap technology.
AI & Semiconductor Dominance
Despite the small-cap rally, the influence of mega-cap technology remains overwhelming. Information Technology captures nearly half of the Top 100 companies' combined market capitalization [Source: https://statranker.org/economy/investments/top-100-companies-by-market-capitalization-2026/]. NVIDIA leads the pack with a market cap ranging between $4.7 trillion and $4.85 trillion, followed by Alphabet ($4.31 trillion), Apple, Microsoft, and Amazon [Source: https://www.fool.com/research/largest-tech-companies/ | https://www.statista.com/statistics/1350976/leading-tech-companies-worldwide-by-market-cap/ | https://www.ceotodaymagazine.com/2026/05/largest-companies-by-market-cap/]. This collective dominance maintains an outsized influence on index performance. The semiconductor earnings validation further cements this trend; ON Semiconductor reported a Q2 2026 net income beat, driven by surging AI data center demand, High-Bandwidth Memory (HBM) requirements, and data center revenue expansion [Source: https://finance.yahoo.com/technology/ai/articles/semiconductor-q2-2026-earnings-beat-121519010.html | https://investor.onsemi.com/news-releases/news-release-details/onsemi-reports-second-quarter-2026-results]. This earnings validation suggests the AI hardware supercycle is not merely a valuation story but is being supported by fundamental revenue growth.
Valuation Divergence and Credit Signals
A significant divergence in valuation multiples is reshaping sector allocation. Traditional high-revenue sectors, including Energy, Industrials, and Financials, trade at compressed valuation multiples relative to technology. This compression reflects a structural reallocation of capital toward AI compute, software ecosystems, and high-margin scalable platforms [Source: https://statranker.org/economy/investments/top-100-companies-by-market-capitalization-2026/]. However, credit markets are flashing nuanced warnings. While large-cap fundamentals remain robust, tech credit spreads are widening, suggesting institutional risk-off positioning in debt markets despite equity strength. This divergence indicates that sophisticated investors are hedging against potential volatility in tech valuations even as they maintain equity exposure. Simultaneously, short interest is rising sharply in speculative segments, with LGPS, TC, MDXH, CCIX, and MBGL showing the largest increases, indicating bearish conviction in these specific names [Source: https://am.gs.com/en-us/advisors/insights/article/market-pulse | https://www.stocktitan.net/rankings/].
2. Performance Landscape: Best & Worst Performers
Top Performers: Speculative Mania vs. Fundamental Leaders
Performance in the current environment is bifurcated between explosive speculative outliers and high-conviction S&P 500 leaders. The data reveals a market where fundamental AI demand and speculative excess coexist.
| Category | Ticker | Company | YTD / Period Gain | Context |
|---|---|---|---|---|
| Speculative Outlier | ELOX | Elox Medical | >1,500,000% | Extreme volatility; speculative biotech/medtech |
| Speculative Outlier | MGRT | Mega Fortune Co. | +1,217% | Top YTD gainer across broad market |
| Speculative Outlier | ANL | Adlai Nortye Ltd. | +862% | High-momentum small-cap |
| S&P 500 Leader | SNDK | Sandisk | +396.1% | Semiconductor storage demand |
| S&P 500 Leader | DELL | Dell Technologies | +256.64% | AI server infrastructure demand |
| S&P 500 Leader | MU | Micron Technology | High Gain | Memory chip demand for AI training |
| Healthcare | AGL | Agilon Health | +467% | Healthcare infrastructure / value-based care |
| Monthly Gainer | MB | MB Financial | +136.6% | August monthly leader |
Sources: https://stockanalysis.com/markets/gainers/ytd/ | https://www.stocktitan.net/rankings/stock-gains-ytd/2026 | https://www.statmuse.com/money/ask/best-performing-stocks-in-s-and-p-500-ytd
The S&P 500 leaders tell a story of AI infrastructure validation. Sandisk (+396.1%), Dell Technologies (+256.64%), and Micron Technology are surging due to insatiable demand for semiconductor storage, AI server infrastructure, and memory chips required for AI training workloads. Agilon Health (+467%) represents a different vector of growth, driven by healthcare infrastructure and value-based care models, highlighting that AI-adjacent growth is not the only source of alpha. Conversely, the speculative outliers like Elox Medical (>1,500,000%) and Mega Fortune Co. (+1,217%) exhibit characteristics of speculative mania. These extreme gains, while mathematically possible in low-float or turnaround scenarios, carry disproportionate risk and often lack fundamental support, serving as cautionary tales for investors seeking yield in volatile segments.
Recent Shifts and Profit-Taking
Despite strong YTD momentum, recent sessions show selective rotation. NVIDIA and HP posted notable daily gains on continued AI infrastructure optimism, while AMD and Micron experienced slight pullbacks, reflecting profit-taking after extended runs and short-term supply constraint concerns [Source: https://www.fool.com/research/largest-tech-companies/ | https://www.finhacker.cz/en/largest-us-companies-by-market-cap/]. This divergence within the semiconductor subsector suggests that while the AI theme remains intact, investors are becoming more discerning, rotating between peers based on relative valuation and near-term catalysts.
Lagging Sectors and Bearish Signals
Explicit bottom-performer rankings are limited in current data, but valuation compression and short interest metrics identify clear areas of weakness. Traditional Energy and Industrials are navigating regulatory headwinds, green transition policies, and compressed valuation multiples relative to tech. Structural demand uncertainty continues to weigh on sector sentiment. Rate-Sensitive Cyclicals and Utilities are facing peak tailwinds for financials as rate cuts approach; however, net interest margin (NIM) compression is pressuring profitability for large-cap banks. Bearish sentiment is concentrated in specific speculative names, with LGPS, TC, MDXH, CCIX, and MBGL seeing the largest rises in short interest, suggesting institutional bets against these positions [Source: https://www.stocktitan.net/rankings/].
3. Bullish & Bearish Sector Outlooks
Technology / Semiconductors: Bullish with Caveats
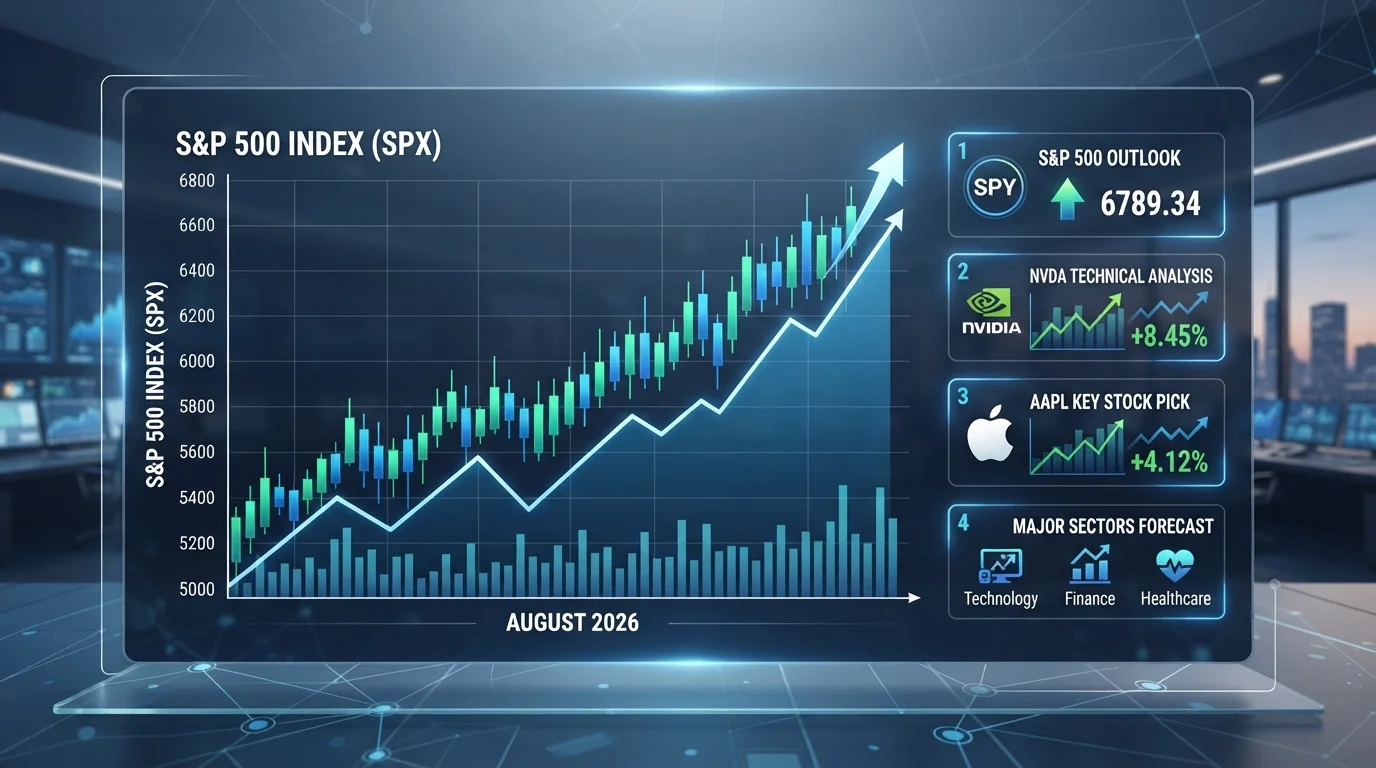
The Technology and Semiconductor sector remains firmly in bullish territory, supported by the AI supercycle earnings validation. ON Semiconductor's Q2 2026 earnings beat, driven by AI data center and HBM demand, confirms that hyperscaler infrastructure spending is translating into semiconductor revenue growth. Tickers like AXTI, SNDK, and MU demonstrate continued momentum. However, valuations are stretched, and earnings growth is currently supporting multiples ahead of critical reports from TSMC, NVIDIA, and AMD. The sector outlook is contingent on these upcoming earnings maintaining the narrative of sustained HBM and data center demand.
Healthcare / Biotech: Bullish Rotation
Healthcare is also bullish, showing strong YTD momentum with AGL (+467%) leading the charge. Demographic tailwinds, an aging population in developed markets, and rotation value as tech multiples stretch are supporting the sector. Healthcare remains among the top sector averages in YTD gains, suggesting that capital is diversifying into healthcare as a defensive growth play [Source: https://www.stocktitan.net/rankings/stock-gains-ytd/2026].
Financials: Neutral / Rotation Tailwind
Financials are neutral to rotation-favored. The Russell 2000's +20.44% YTD gain suggests small-cap financials and cyclicals are benefiting from rate cut expectations. However, large-cap banks face headwinds from NIM compression and compressed multiples relative to tech. The sector is a beneficiary of the rotation trade but faces margin pressure that limits upside potential for large-cap names.
Energy: Bearish Structural Headwinds
Energy is bearish due to regulatory shifts, demand uncertainty, and structural transition headwinds that outweigh near-term supply constraints. The sector trades at a significant valuation discount to AI/tech, reflecting a structural bearish outlook for legacy sectors as capital flows toward AI-adjacent platforms [Source: https://alphio.ai/blog/sp500-market-outlook-august-2026].
Industrials: Mixed Outlook
Industrials present a mixed outlook. Hyperscaler buildout supports specific subsectors, but broader demand remains tied to trade policy and rate expectations. Small-cap industrials may see tailwinds from domestic rotation, but the sector is vulnerable to macro volatility [Source: https://am.gs.com/en-int/advisors/insights/article/market-pulse].
4. Evidence-Backed Theses
🐂 Bullish Thesis: AI-Driven Productivity & Broadening Rally
The primary bullish thesis rests on the convergence of earnings-validated AI capex, a broadening rally, and demographic tailwinds. ON Semiconductor's Q2 2026 earnings beat confirms that hyperscaler infrastructure spending is translating into semiconductor revenue growth, validating the AI capex cycle. The Russell 2000's +20.44% YTD gain indicates a broadening rally where rate-sensitive small caps and cyclicals are attracting capital, reducing reliance on mega-cap concentration. Furthermore, aging populations in developed markets are accelerating automation, healthcare tech, and productivity software adoption, supporting long-term structural growth in Tech and Healthcare [Source: https://finance.yahoo.com/technology/ai/articles/semiconductor-q2-2026-earnings-beat-121519010.html | https://stockanalysis.com/markets/gainers/ytd/ | https://www.fool.com/research/2026-investor-outlook-and-predictions/].
🐻 Bearish Thesis: Concentration Fragility & Speculative Excess
The bearish thesis highlights concentration fragility, credit divergence, and speculative excess. With ~50% of the Top 100 market cap concentrated in IT/AI, and three names driving a disproportionate share of S&P 500 returns, a single earnings miss could trigger disproportionate drawdowns [Source: https://alphio.ai/blog/sp500-market-outlook-august-2026 | https://statranker.org/economy/investments/top-100-companies-by-market-capitalization-2026/]. Tech credit spreads are widening, suggesting institutional risk-off positioning despite strong fundamentals. Extreme YTD gainers like ELOX and MGRT exhibit speculative mania characteristics, while rising short interest in CCIX and MBGL highlights ongoing friction that could lead to volatile reversals [Source: https://am.gs.com/en-us/advisors/insights/article/market-pulse | https://www.stocktitan.net/rankings/]. Additionally, macro risks such as escalating trade tensions, delayed Fed easing, or AI monetization disappointment could reverse the rotation trade.
5. Near-Term Catalysts & Monitoring Points

Semiconductor Earnings Calendar
The week of August 10–14, 2026, features the TSMC, NVIDIA, AMD, and ON Semiconductor results as the primary catalyst for sector direction. Revenue growth, HBM demand signals, and data center margin trajectories will validate or challenge the AI capex thesis. Any deviation from expectations could amplify volatility given the sector's stretched valuations.
Fed Policy & Rate Cuts
Market pricing for September/October cuts remains a key driver for financials, utilities, and rate-sensitive cyclicals. However, FedWatch data indicates a 62% probability of a hold, 36% probability of a hike, and only a 2% probability of a cut at the upcoming FOMC meeting [Source: https://predictionmarketspicks.com/tools/fed-rate-tracker | https://www.cmegroup.com/markets/interest-rates/cme-fedwatch-tool.html]. This creates a tension: the Russell 2000's outperformance suggests the market is pricing in easing, but derivatives imply hawkishness. Core CPI, NFP, and Core PCE have significant impact on rate probabilities, with Core CPI moving cut probabilities by 6–10 percentage points per standard deviation surprise. A hot CPI print could trigger a sharp reversal in small-cap outperformance.
Trade & Geopolitics
Ongoing tariff negotiations and supply chain realignment continue to pressure energy, industrials, and import-heavy consumer sectors. Investors must monitor trade policy developments for signs of escalation that could disrupt the domestic rotation trade.
Short Interest Monitoring
Rising short interest in LGPS, TC, MDXH, CCIX, and MBGL warrants monitoring for potential short squeezes or continued downside pressure in speculative names. These positions represent concentrated bearish bets that could amplify volatility in either direction.
Conclusion
The U.S. equity market on August 8, 2026, is a study in contrasts. The Russell 2000's +20.44% YTD lead signals a healthy broadening of the rally, with capital rotating into rate-sensitive small-caps and cyclicals. This rotation is supported by the earnings validation of the AI hardware supercycle, as demonstrated by ON Semiconductor's Q2 beat and the dominance of names like NVIDIA ($4.7T–$4.85T) and Alphabet ($4.31T). However, this optimism is tempered by significant risks. The concentration of ~50% of the Top 100 market cap in IT/AI creates index fragility, while widening tech credit spreads and rising short interest in speculative names suggest underlying institutional caution.
The sector outlook favors Technology/Semiconductors and Healthcare, while Energy remains bearish and Financials are neutral. The coming week is pivotal, with TSMC, NVIDIA, and AMD earnings and an FOMC meeting where derivatives imply a 62% hold and 36% hike probability. The divergence between the Russell 2000's rate-cut pricing and the Fed's hawkish derivatives represents a key risk; any macro data surprise could trigger a sharp repricing. Investors should remain focused on earnings validation, monitor credit signals for early warning of stress, and maintain awareness of the speculative excess evident in names like ELOX and MGRT. The market's ability to sustain the rotation trade while navigating concentration risk and macro uncertainty will define performance in the remainder of 2026.
Report compiled from publicly available research and market data as of August 8, 2026. All performance data reflects year-to-date returns unless otherwise noted. Past performance does not guarantee future results. This report is for informational purposes and does not constitute investment advice.