

Date: 2026-08-06
Channel: Market Signal
Run Type: Scheduled Daily Edition
Executive Summary
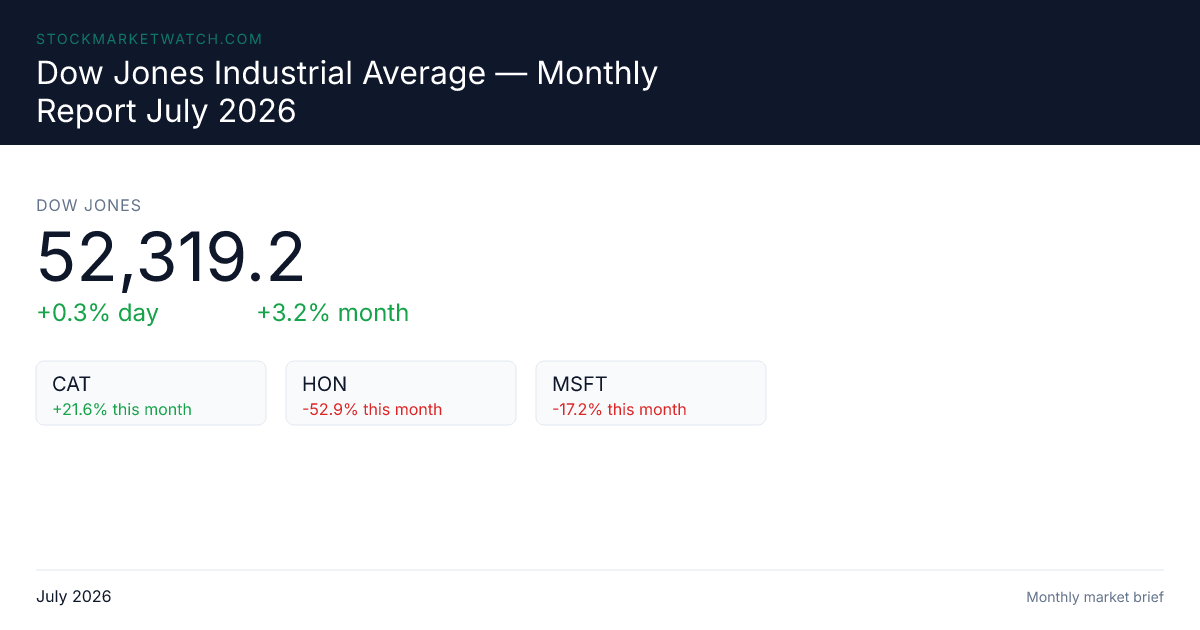
Global equity markets in early August 2026 are navigating a highly constructive but exceptionally narrow environment. Major indices are posting solid year-to-date gains, with the S&P 500 up approximately 13.80%, the Dow Jones Industrial Average at +18.54%, the Small-Cap index leading the pack at +22.36%, and the Nasdaq 100 at +16.74% CSIMarket. Yet beneath these headline numbers lies a market defined by extreme dispersion, tactical rotation, and mounting structural tensions. J.P. Morgan has raised its year-end S&P 500 target to 7,800, anchored by a forecasted +29% earnings per share (EPS) growth rate and what it terms an AI-driven “upstream supercycle” J.P. Morgan Mid-Year Outlook. Meanwhile, a pronounced rotation is emerging into commodities and gold miners, with the GOEX and RING ETFs surging as investors hedge against sticky 3% inflation and geopolitical fragmentation Global X ETFs. Despite the bullish earnings backdrop, risks remain acute: momentum factor crowding, an ongoing energy supply shock, elevated real yields at 4.70%, and seasonal volatility ahead of the U.S. midterms. This report synthesizes market structure, evidence-backed theses, performance data, sector outlooks, and fresh catalysts to provide a comprehensive view of where capital is flowing, why it matters, and what investors should watch.
Market Structure & General Trends
Macro Framework: Rates, Inflation, and Growth Divergence
The macro backdrop in August 2026 is defined by a “higher for longer” monetary regime, persistent inflation, and divergent global growth trajectories. The Federal Reserve remains on hold, with the 10-year U.S. Treasury yield anchored at 4.70% J.P. Morgan Baseline Forecast. This yield level is far from neutral; it actively compresses valuation multiples for long-duration assets and forces capital to compete with risk-free returns. Simultaneously, global inflation remains stubbornly sticky at approximately 3%, driven by geopolitical fragmentation, energy supply constraints, and resilient labor markets J.P. Morgan Mid-Year Outlook. This inflation persistence limits the Fed’s ability to pivot aggressively, creating a policy environment that favors quality, cash-generative businesses over speculative growth.
Growth divergence is equally significant. U.S. economic expansion is forecast at 1.5–1.75%, outpacing the Eurozone but lagging China’s projected 4.7% J.P. Morgan Mid-Year Outlook. This divergence supports a “U.S. quality” premium for domestic large-caps while simultaneously creating relative value opportunities in Chinese and emerging market assets. The U.S. dollar’s continued strength against major peers (CAD, EUR, JPY, SEK) reflects these growth and yield differentials, though it acts as a headwind for international investors and multinationals with significant non-USD revenue streams J.P. Morgan Mid-Year Outlook.
Index Performance vs. Stock Dispersion
While headline indices are posting double-digit gains, the underlying stock market tells a far more fragmented story. The Small-Cap index’s +22.36% YTD return indicates strong domestic breadth, yet this breadth coexists with extreme concentration within the S&P 500. Analysis reveals that gains are overwhelmingly concentrated in AI hardware, semiconductors, and data storage, while the median stock significantly lags the index average StockAnalysis. This “wealth effect” is narrow, meaning that portfolio performance is highly dependent on sector allocation and stock selection rather than passive beta exposure. The disconnect between index returns and individual stock performance underscores the importance of active management and tactical positioning in the current environment.
Short-Term Consolidation and Tactical Rotation
The S&P 500 has been consolidating since early June without reaching new all-time highs, holding a +9.6% to +13.8% YTD return depending on the measurement window Seeking Alpha. Despite this lack of new highs, the index maintains a 22.20% annualized return, indicating a healthy consolidation within a strong structural trend. However, the monthly pullback of -0.96% alongside surging gold and mining ETFs signals a tactical rotation into defensive and inflation-hedge positioning Yahoo Finance. This rotation is not necessarily bearish; rather, it reflects institutional rebalancing and risk management in response to elevated volatility, midterm election uncertainty, and geopolitical fragmentation The Motley Fool.
Evidence-Backed Bullish Theses
The AI Upstream Supercycle
The primary driver of equity outperformance in 2026 is the AI infrastructure build-out, which J.P. Morgan identifies as a multi-year “upstream supercycle” J.P. Morgan Mid-Year Outlook. Unlike previous technology cycles that rewarded software and platform companies, this cycle is heavily weighted toward hardware, semiconductors, data storage, and specialized industrial suppliers. Edward Jones reinforces this view, citing innovation and AI as central themes for the year Edward Jones. The structural nature of this demand is supported by massive enterprise and hyperscaler capex commitments, with visibility extending through 2027. Companies positioned at the front end of this supply chain—particularly in high-bandwidth memory, NAND storage, and data center interconnects—are capturing unprecedented revenue growth and margin expansion.
Earnings Momentum and Valuation Support
With EPS growth forecast at +29%, the fundamental backdrop for equities is historically strong. This earnings momentum provides a robust floor for valuations and directly supports J.P. Morgan’s year-end S&P 500 target of 7,800 J.P. Morgan Mid-Year Outlook. The market is pricing in significant AI capex-to-revenue conversion, and as long as corporate earnings continue to accelerate, current multiples remain justified. Fidelity’s “Age of Alpha” thesis further suggests that stock selection and sector rotation are generating superior returns compared to passive beta exposure, favoring concentrated, actively managed portfolios Fidelity International Outlook. This environment rewards investors who can identify earnings catalysts and rotate out of crowded momentum trades before they unwind.
International and Emerging Market Value
International equities, particularly emerging markets, present a compelling diversification play. The MSCI EM index carries a target of 2,000, driven by China’s higher growth trajectory (4.7%) and historically attractive valuations J.P. Morgan Mid-Year Outlook. SSGA’s “Forward with Focus” outlook supports selective international allocation as a counterbalance to crowded U.S. momentum factors SSGA. While the strong U.S. dollar creates near-term FX headwinds, the valuation gap and growth differential suggest that international assets are positioned for relative outperformance over a 12-to-24-month horizon.
Active Management and Commodity Hedges
The surge in gold and mining sectors validates a bullish thesis for materials and precious metals as a persistent inflation hedge. GOEX has posted 55.86% annualized returns with a 1.82 beta to the S&P 500, highlighting the sector’s leverage to gold prices Global X ETFs. This outperformance is supported by expectations of eventual Fed rate cuts, gold’s traditional safe-haven status, and geopolitical fragmentation driving physical demand. The rotation into GOEX and RING (iShares MSCI Global Gold Miners ETF) signals that institutional capital is actively hedging against sticky inflation and supply chain disruptions, rather than exiting equities entirely.
Evidence-Backed Bearish Theses

Momentum Crowding and Equity Supply Risks
J.P. Morgan explicitly warns of momentum factor crowding and rising equity supply as key risks J.P. Morgan Mid-Year Outlook. Overconcentration in AI winners creates vulnerability to sentiment shifts; when too many investors hold the same crowded trades, even minor negative catalysts can trigger disproportionate selling. Additionally, increased equity issuance may dilute earnings per share, compressing multiples if demand does not keep pace. The narrow breadth of the current rally amplifies this risk, as a rotation out of the top AI names could drag down the entire index despite strong underlying earnings.
Energy Supply Shocks and Inflation Persistence
An ongoing energy supply shock poses a direct threat to corporate margins and consumer demand. This shock contributes to sticky 3% inflation and limits the Fed’s flexibility, potentially triggering a sudden repricing of risk assets J.P. Morgan Mid-Year Outlook. Energy-intensive sectors face margin compression, while consumers with elevated energy costs reduce discretionary spending. The combination of supply constraints and resilient demand creates a stagflationary undertone that challenges the sustainability of high-growth valuations without continued earnings acceleration.