
Edition Date: 2026-08-05
Channel: Market Signal
Run Type: Scheduled Daily Edition
Executive Summary
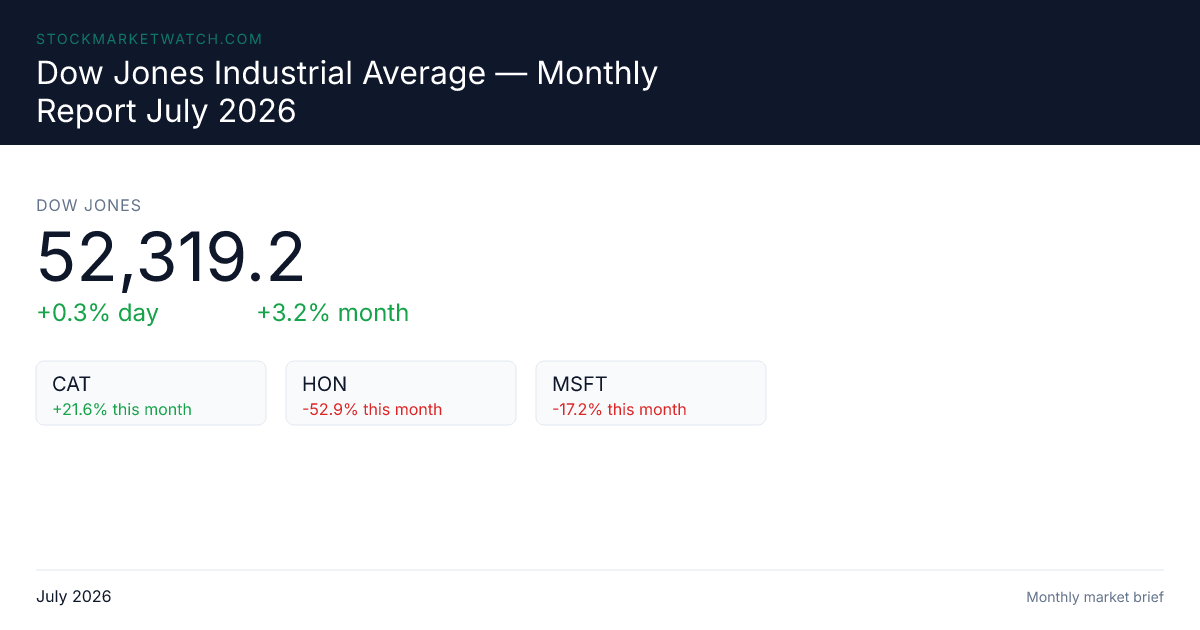
Global equity markets as of early August 2026 are defined by a profound structural bifurcation. The S&P 500 has delivered a +13.02% year-to-date return, while the Dow Jones Industrial Average has touched a record close of 52,319.20, yet this aggregate performance masks extreme dispersion across sectors, asset classes, and market capitalizations. The market is no longer a monolith; it is a two-speed economy where physical infrastructure and energy dominance collide with the collapse of intangible software and defensive positioning.
The primary drivers of this divergence are a $700 billion hyperscaler capital expenditure cycle fueling a tangible AI infrastructure supercycle and a geopolitical supply shock in the Strait of Hormuz that has pushed crude oil to $126 per barrel. Consequently, Energy (+27.83% YTD) and Technology (+21.91% YTD) remain the dominant engines of return, while defensive, software-heavy, and speculative sectors are lagging significantly. Utilities (+2.01%), Consumer Discretionary (+3.04%), and Health Care (+4.08%) trail the broader index, reflecting a rotation away from safety and intangibles.
Forward consensus projects 15% full-year CY2026 earnings growth, supported by robust Q2 revenue trajectories (+12.2% revenue growth) and anticipated late-2026 Fed rate cuts. However, the market is navigating a critical inflection point. The upcoming FOMC meeting under Chair Kevin Warsh features a new dot plot that will recalibrate rate expectations, while capital rotation is actively shifting from enterprise software and ad-tech into physical AI infrastructure and small/mid-caps. Small Caps now lead the market at +22.37% YTD, signaling broadening participation. Despite strong earnings momentum, valuation stretch remains a concern, with PEG ratios indicating overvaluation risks in high-multiple sectors, tempering the upside narrative.
Market Structure & General Trends
Technical Landscape and Divergences
The technical structure of global equities reveals a complex interplay between sustained institutional optimism and emerging divergences. Major indices, including the NASDAQ, Euro Stoxx 50, Singapore Straits Times, and Nikkei 225, are trading within rising medium-long-term trend channels, confirming a sustained bullish bias among institutional investors Source: Investtech. However, this alignment is not universal. The Nikkei 225, while maintaining its rising channel, is displaying negative RSI divergence, suggesting potential downward reactions despite the structural uptrend Source: Investtech. Meanwhile, Asian weakness is more pronounced; the KOSPI and Shanghai Composite have broken below their rising trend channels, indicating weaker momentum in key Asian markets compared to their US and European counterparts Source: Investtech.
A critical macro divergence is emerging between the yield curve and speculative assets. A deeply inverted yield curve persists, signaling underlying economic stress, yet this has not prevented the equity rally. Simultaneously, the crypto market is experiencing a violent correction that decouples from traditional risk-on correlations. Record $4 billion+ outflows from Bitcoin ETFs and an 88% collapse in leveraged crypto ETFs (such as SBET) highlight speculative exhaustion. This divergence suggests that while institutional capital is rotating into equities, speculative leverage is being purged from the system, potentially reducing tail risks but also removing a source of retail liquidity Source: Finobird.
Momentum and Rotation Dynamics
Momentum factors staged a sharp bounce following the July decline, fueling the S&P 500's return to all-time highs. Daily rotation data as of August 4, 2026, reveals a distinct shift in capital flows. Communication Services (+2.86%), Industrials (+1.85%), and Consumer Discretionary (+1.83%) are leading daily gains, while Energy (-1.28%), Consumer Staples (-0.22%), and Health Care (-0.19%) are the worst performers on a daily basis. This signals short-term profit-taking in Energy after its massive run and a rotation toward growth, cyclicals, and small/mid-caps. The daily underperformance of Energy, despite its YTD dominance, suggests that the market is pricing in a potential stabilization of geopolitical premiums, even as the structural thesis for energy remains intact Source: Stockbase, Source: Investtech, Source: CSIMarket.
Earnings Dominance
Q2 2026 earnings have delivered robust but narrow growth. EPS growth is running approximately 20–25% YoY, with an ~85% beat rate, driven primarily by energy and technology names. Forward consensus remains constructive at 15% full-year CY2026 earnings growth, supported by Q2 revenue trajectories showing +12.2% revenue growth. However, this growth is concentrated; the breadth of earnings expansion is limited, reinforcing the theme of a bifurcated market where winners are winning by widening margins while laggards face estimate cuts Source: FactSet, Source: CNBC.
Evidence-Backed Bullish Theses
1. Energy Sector Supercycle and Geopolitical Premium
The Energy sector stands as the undisputed YTD leader with a +27.83% return, driven by the Hormuz crisis which pushed crude to $126/bbl. The bullish thesis is anchored in geopolitical supply constraints that are unlikely to resolve in the near term. The $92–$126/bbl range provides a significant margin of safety for energy producers, as even a partial easing of tensions would still leave prices well above historical averages. Strong free cash flow generation supports outperformance, and the sector's ability to generate tangible returns in an environment of high rates makes it a structural favorite. While daily profit-taking (-1.28% on Aug 4) indicates short-term rotation risk, the medium-term outlook remains firmly bullish as long as geopolitical premiums persist Source: USBaseline, Source: RCK Analytics, Source: Alpha Sense.
2. Technology and AI Infrastructure Leadership
Technology (+21.91% YTD) is sustained by the $700 billion hyperscaler capex cycle and a memory super-cycle. The market's investment thesis has structurally shifted from intangible software to tangible AI infrastructure. Names like Palantir, Zebra Technologies, and Marvell Technology have posted double-to-triple-digit daily gains, confirming sustained capital inflows into the physical backbone of AI. The bullish case here is that the capex cycle is not a bubble but a necessary build-out of compute capacity that will drive revenue growth for years. This is supported by the massive YTD gains in storage and semiconductor names: Dell, Seagate, Western Digital, and Micron are posting gains exceeding +180% to +265%, reflecting the physical demand for data storage and processing Source: StockTitan, Source: Markets Insider, Source: Alpha Sense.
3. Small and Mid-Cap Outperformance
Small Caps (+22.37% YTD) are now leading broad indices, outperforming the Dow (+17.41%) and S&P 500 (+13.02%). This signals broadening participation beyond mega-cap anchors and suggests that the market rally is becoming more sustainable. Mid-caps are forecast to outperform large-caps in Q3, supported by strong IPO activity from companies like SpaceX, Cerebras, and Quantinuum, and robust deal momentum. The rotation into small caps is also a bet on domestic economic resilience and the benefits of reshoring, which disproportionately favors smaller industrial and technology firms Source: CSIMarket, Source: Stockbase, Source: Alpha Sense.
4. Monetary Support and Late-2026 Rate Cuts
Anticipated Fed rate cuts are sustaining economic expansion and supporting risk asset valuations. The upcoming Fed meeting under Chair Warsh lacks new rate projections but introduces a new dot plot that will recalibrate rate expectations. If the dot plot signals cuts, it will reinforce the bullish case by lowering the discount rate for future earnings. Guidance quality and labor market softening signals are decisive factors for sustaining the rally. The consensus view is that late-2026 cuts will provide a tailwind for cyclicals and growth stocks, particularly those sensitive to duration Source: Financial Express, Source: MCapital Management.
5. Global Equity Rally Through 2027
Loomis Sayles projects a continued global equity rally through 2027, anchored by AI-driven capex, robust corporate earnings, and attractive yield opportunities in corporate credit and select emerging market currencies. This thesis aligns with the iShares observation of above-trend growth and easing policy, suggesting that the bull market is not yet over and that diversification into global assets and income strategies can complement equity exposure Source: Loomis Sayles, Source: iShares.
Evidence-Backed Bearish Theses

1. Valuation Stretch and PEG Risks
Elevated valuations remain the primary bearish concern. The S&P 500 is trading at 20.3x P/E, and PEG ratios indicate overvaluation in high-multiple sectors. Alaric Securities' mid-year review highlights that forward valuations in high-multiple sectors are stretched relative to earnings growth, warranting caution despite strong earnings beats. Typical quarterly trends see downward estimate revisions, making the current upward surge an outlier driven primarily by energy and tech. If earnings growth disappoints, the multiple compression could be severe Source: Alaric Securities, Source: RCK Analytics, Source: FactSet.
2. Enterprise Software, Cybersecurity, and Ad-Tech Collapse
The market is actively rotating away from intangible tech. CrowdStrike, Intuit, and The Trade Desk have declined between -48% and -53% YTD, illustrating severe capital flight from enterprise software, cybersecurity, and digital advertising. This collapse is not just a sector rotation but a repricing of the "intangible economy" in a higher-for-longer rate environment. Companies that rely on subscription models and discretionary IT spending are facing headwinds as enterprises prioritize physical infrastructure and cost-cutting. The magnitude of the decline suggests a structural shift in investor preference rather than a temporary cyclical downturn Source: CSIMarket.
3. Health Care Sector Contraction
Health Care is the worst-performing sector in returns (+4.08% YTD vs. S&P 500 +13.02%) and the sole sector contracting in estimates, with a -15.3% EPS estimate cut led by Merck and Eli Lilly. Patent cliffs, shifting consumer demand, and macro uncertainty weigh heavily on defensive positioning. The bearish thesis here is that Health Care is no longer a safe haven; investors are rotating out of defensives into cyclicals and energy, leaving the sector vulnerable to multiple compression and earnings downgrades Source: RCK Analytics, Source: StockWireX, Source: realcpi.org.
4. Inverted Yield Curve and Higher-for-Longer Rates
A deeply inverted yield curve persists, with the Fed funds rate holding at 5.25%–5.50%. While late-2026 cuts are anticipated, the "higher for longer" reality continues to pressure highly leveraged and duration-sensitive assets. The inversion signals that the market expects a recession, which could eventually dampen corporate earnings. The bearish case is that the equity rally is pricing in a soft landing that may not materialize, and the yield curve inversion is a leading indicator of economic stress that will eventually manifest in earnings Source: Finobird, Source: Financial Express.
5. AI Monetization Skepticism and Consensus Overreach
Despite massive capex, skepticism over profit translation remains. Disappointing AI monetization results from Oracle and Adobe highlight the risk of a "capex wall" without proportional revenue conversion. Loomis Sayles warns that consensus AI earnings expectations may prove overly optimistic. The bearish thesis is that the $700 billion capex cycle may yield diminishing returns, and if AI does not generate the expected revenue growth, the hardware supercycle could reverse sharply, taking storage and semiconductor stocks down with it Source: Alpha Sense, Source: RCK Analytics, Source: Loomis Sayles.
6. Crypto and Speculative Asset Volatility
Bitcoin ETFs recorded record $4 billion+ outflows, and leveraged crypto vehicles like SBET collapsed 88%. This signals speculative exhaustion and a dangerous decoupling from traditional risk-on correlations. The bearish implication is that the purge of speculative leverage reduces liquidity in the broader market and could trigger a risk-off event if correlations reverse. The collapse of leveraged crypto ETFs also suggests that retail investors are exiting the market, removing a source of demand for growth stocks Source: Finobird.
Sector Outlooks and Performance Matrix
Bullish Sector Outlooks
| Sector | YTD Return | Rationale |
|---|---|---|
| Energy | +27.83% | Top YTD performer. Hormuz crisis drives crude to $126/bbl. Geopolitical supply constraints and strong FCF support outperformance, though daily profit-taking (-1.28% Aug 4) signals short-term rotation risk. |
| Technology / AI Hardware | +21.91% | Driven by $700B hyperscaler capex, memory super-cycle, and physical infrastructure demand. Storage & semiconductor names (Dell, Seagate, WDC, Micron) leading gains (+180-265% YTD). |
| Industrials & Small/Mid-Caps | +17.87% / +22.37% | Benefiting from reshoring, infrastructure spending, and capital rotation. Small caps now leading broad indices, supported by strong IPO activity and deal momentum. |
| Communication Services | N/A | Leading daily performer (+2.86% Aug 4). Rotation into growth and tech-adjacent sectors is accelerating, with institutional consensus supporting continued outperformance through 2027. |
Bearish Sector Outlooks
| Sector | YTD Return | Rationale |
|---|---|---|
| Enterprise Software / Cybersecurity / Ad-Tech | -48% to -53% | Worst-performing thematic group. CrowdStrike, Intuit, and Trade Desk collapsing YTD as capital flees intangible tech for physical infrastructure and hardware. |
| Health Care | +4.08% | Worst relative performer. -15.3% EPS estimate cut led by Merck and Eli Lilly. Patent cliffs and shifting demand weigh on defensive positioning. |
| Utilities & Consumer Staples | +2.01% / -0.22% | Lagging sectors. Rotation away from defensives and multiple compression risks persist. Consumer Discretionary (+3.04%) also trails, reflecting structural headwinds. |
Best and Worst Performers
Top Performers
- YTD Sector Leaders: Energy (XLE) leads all sectors with a +27.83% YTD return, followed by Technology at +21.91% and Industrials at +17.87% Source: realcpi.org.
- YTD Large-Cap Leaders: Dell (DELL), Seagate (STX), Western Digital (WDC), and Micron (MU) dominate with massive YTD gains exceeding +180% to +265%, reflecting the physical infrastructure supercycle. Sandisk (SNDK) also posts exceptional returns (+501.8% YTD). The top 50 S&P 500 performers show a median YTD return of +67.9% Source: ChartRow, Source: Westmount Fundamentals, Source: CSIMarket.
- Index Leaders: Small Caps (+22.37% YTD) are outperforming the Dow (+17.41%) and S&P 500 (+13.02%), signaling broadening market participation Source: CSIMarket.
- Daily Gainers (Aug 4): Communication Services (+2.86%), Industrials (+1.85%), and Consumer Discretionary (+1.83%) Source: Stockbase.
Worst Performers
- YTD Thematic Laggards: Enterprise Software, Cybersecurity, and Ad-Tech are collapsing, with CrowdStrike (-48%), Intuit (-51%), and The Trade Desk (-53%) leading the decline Source: CSIMarket.
- YTD Sector Laggards: Utilities (+2.01%), Consumer Discretionary (+3.04%), and Health Care (+4.08%) are the worst-performing sectors year-to-date Source: realcpi.org.
- Daily Losers (Aug 4): Energy (-1.28%), Consumer Staples (-0.22%), and Health Care (-0.19%) Source: Stockbase.
- Sector Contraction Leaders: Merck and Eli Lilly led the Health Care sector's -15.3% EPS estimate cut, illustrating capital rotation away from traditional defensive healthcare stocks Source: RCK Analytics, Source: StockWireX.
- Speculative Asset Collapse: Leveraged crypto ETFs like SBET collapsed 88%, and Bitcoin ETFs saw record $4 billion+ outflows, highlighting extreme speculative exhaustion Source: Finobird.
Fresh News and Context
- Fed Meeting and Warsh Dot Plot: The US Fed FOMC meeting features a new dot plot under Chair Kevin Warsh. While no new rate projections are included, the dot plot will recalibrate market expectations for late-2026 rate cuts. Guidance quality and labor market signals are pivotal for the August rally. The market is watching for any hint of a more dovish stance, which could further boost cyclicals and small caps Source: Financial Express.
- Hormuz Crisis and Oil Prices: Crude oil prices surged to $126/bbl driven by the Hormuz crisis. Geopolitical supply constraints are the primary catalyst for the Energy sector's +27.83% YTD outperformance, though daily profit-taking suggests short-term rotation risk. The crisis also highlights the vulnerability of global supply chains and the inflationary risks associated with energy shocks Source: USBaseline.
- Hardware vs. Software Rotation: The market's investment thesis has structurally shifted from intangible software to tangible AI infrastructure. Storage, semiconductors, and physical hardware are posting triple-digit YTD gains, while enterprise software, cybersecurity, and ad-tech are down 48-53% YTD. This rotation reflects a preference for assets with tangible value and strong free cash flow in a high-rate environment Source: CSIMarket, Source: StockTitan.
- Institutional Consensus and Portfolio Construction: Loomis Sayles projects a global equity rally through 2027 anchored by AI capex and corporate earnings. iShares highlights above-trend growth and easing policy, with portfolio construction increasingly driven by income needs—allocating to EM debt, securitized assets, dividend stocks, and options strategies. This suggests that institutions are balancing equity exposure with income-generating assets to manage risk Source: Loomis Sayles, Source: iShares.
- Valuation Review: Alaric Securities' mid-year review highlights PEG ratio concerns, noting that forward valuations in high-multiple sectors are stretched relative to earnings growth, warranting caution despite strong earnings beats. This serves as a counterpoint to the bullish consensus and suggests that the market may be pricing in too much optimism Source: Alaric Securities.