

The U.S. equity and digital asset markets as of late July 2026 are defined by a profound structural bifurcation. While headline indices like the Dow Jones Industrial Average have carved out fresh all-time highs near 52,210, this nominal strength masks a deeply uneven market where AI infrastructure, cloud computing, and select crypto-adjacent assets are decoupling from leveraged plays, altcoins, and rate-sensitive small-cap equities. The Federal Reserve’s decision to hold the fed funds rate at 5.25%–5.50% reinforces a prolonged higher-for-longer environment, compressing valuations for speculative assets while rewarding cash-generative mega-caps and income-focused allocations. The investment landscape is no longer a broad-based rally; it is a selective regime favoring quality, productivity-driven earnings, and institutional liquidity conduits. This report synthesizes market structure, performance data, competing macro theses, and fresh catalysts to map the current risk-reward landscape, highlighting where capital is flowing, where it is retreating, and what structural signals investors should monitor moving forward.
Market Structure & Macro Backdrop
The Divergence Between Headline Indices and Underlying Breadth
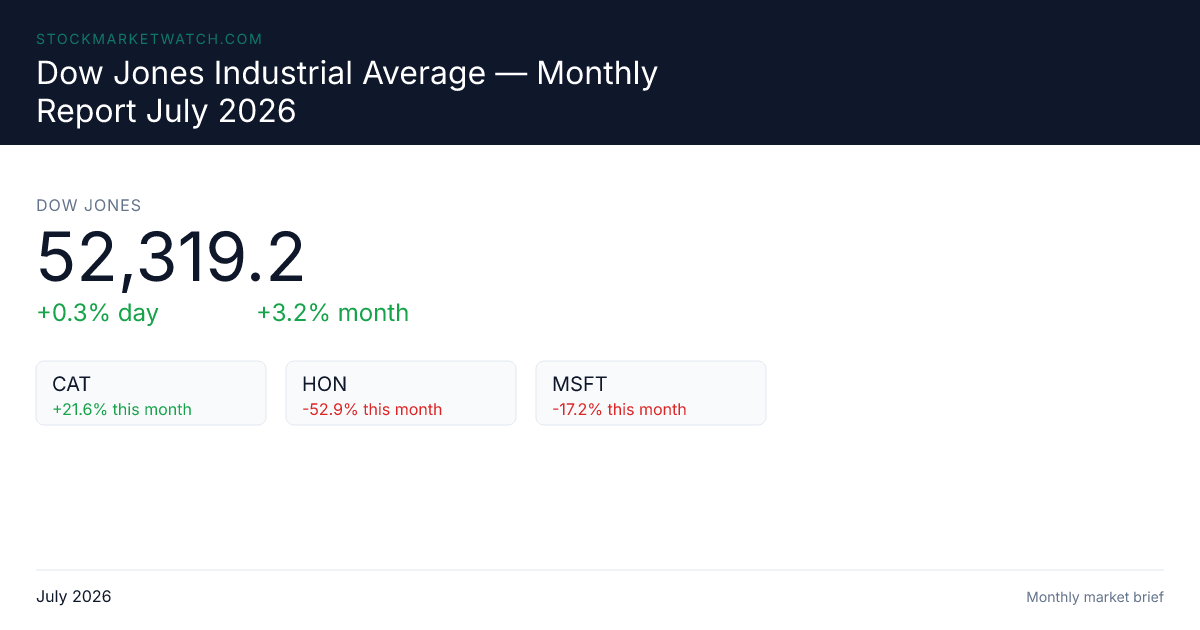
The Dow Jones Industrial Average’s climb from 51,711.65 to 52,210.08 over a single trading week underscores a market driven by concentrated leadership rather than broad participation. This narrow breadth is not merely a statistical anomaly; it reflects a fundamental reallocation of institutional capital toward assets with demonstrable cash flows, pricing power, and exposure to the AI infrastructure buildout. When a handful of mega-cap technology and AI-adjacent names carry an index to new highs, the underlying market structure becomes fragile. A shift in sentiment, an earnings miss from a hyperscaler, or a sudden repricing of rate expectations can trigger outsized volatility precisely because the rally lacks breadth. Historically, such concentrated leadership periods have preceded either sustained multi-year bull markets (if earnings validate the capex cycle) or sharp mean-reversion corrections (if macro conditions deteriorate). The current environment sits squarely in the former category, but the margin for error is thin.
Compounding this structural divergence is the persistent gap between nominal asset prices and real purchasing power. Since May 2015, the DJIA has delivered a 106.07% inflation-adjusted return, annualizing to 6.69% FRED. Over a five-year horizon, a $100 investment has historically produced a 21.46% real return after inflation Finobird. These figures remind investors that headline highs must be evaluated through the lens of purchasing-power erosion. In an environment where inflation remains sticky and the Fed refuses to pivot aggressively, nominal portfolio growth must outpace the cost of living to preserve wealth. This reality is accelerating a rotation away from speculative growth toward assets that offer both capital appreciation and income generation.
The Fed’s Higher-for-Longer Stance and Inflation Reality
The Federal Reserve’s July 2026 Monetary Policy Report characterizes the economy as experiencing solid expansion fueled by strong capital investment and productivity growth, yet it simultaneously warns of elevated inflation (4.1% PCE, 4.2% May CPI) and geopolitical energy supply risks Federal Reserve Board. Maintaining the fed funds rate at 5.25%–5.50% signals that policymakers view inflation as structurally stickier than markets hoped. This stance has profound implications for asset pricing. Higher discount rates compress the present value of future earnings, disproportionately penalizing long-duration assets like unprofitable tech, leveraged crypto vehicles, and small-cap equities reliant on cheap debt. Conversely, it rewards dividend-paying equities, short-duration fixed income, and cash-generative businesses with pricing power.
Where sources converge is on the Fed’s data-dependent posture: inflation remains above the 2% target, household consumption is modest, and energy supply shocks add upside risk to input costs Intellectia AI. Where they diverge is on the timing and magnitude of a potential pivot. Some analysts argue that late-2026 rate cuts are already priced in, which would disproportionately benefit growth and small-cap equities if inflation cools. Others contend that the Fed’s language signals a prolonged hold, making multiple compression in the technology sector a near-term certainty. This disagreement creates a market environment where positioning for either scenario requires careful risk management, as premature bets on easing or tightening can lead to significant drawdowns.
Best & Worst Performers: A Tale of Two Markets

The AI Infrastructure & Select Crypto Winners
Year-to-date performance data reveals a sharp performance divide, with gains heavily concentrated in AI infrastructure, cloud computing, and a narrow slice of crypto-adjacent ETFs. Nvidia (NVDA) and Microsoft (MSFT) continue to dominate, driven by hyperscaler capex cycles, cloud earnings beats, and the tangible monetization of generative AI workloads. The success of these names is not speculative; it is grounded in recurring revenue, expanding margins, and multi-tranche institutional commitments that validate the AI infrastructure buildout.
In the digital asset space, a fascinating rotation has emerged. Solana ETFs have attracted $370.0M in YTD inflows, while XRP ETFs pulled in $339.9M, outperforming both Bitcoin and Ethereum CryptoETF.Today. This is not a blanket rally for crypto; it is a selective demand rotation toward specific layer-one ecosystems with demonstrated transaction volume, developer activity, and institutional-grade custody solutions. The 120% surge in tokenized real-world asset (RWA) transfers further indicates that sophisticated capital is seeking yield and utility within blockchain infrastructure, rather than chasing speculative beta Narracomm. Solana’s +15% weekly rebound and XRP’s relative strength suggest that not all digital assets are created equal in a risk-off macro environment.
The Leveraged, Rate-Sensitive, and Crypto-Exposed Losers
On the flip side, the worst performers cluster in leveraged crypto vehicles, altcoins, and rate-sensitive small/mid-cap names. Sharplink’s SBET ETF has collapsed by 88% YTD, a stark reminder of how quickly leveraged structures can amplify downside in volatile markets. Bitcoin ETFs have recorded $5.17B in YTD net outflows, while Ethereum ETFs have shed $1.12B, reflecting a structural rotation away from digital assets toward traditional risk-free and income-generating instruments CryptoBriefing. The $8B outflow streak over eight weeks, including a record $4.06B weekly drain in June, underscores sustained institutional risk aversion CoinDesk.
SoftBank Group (SFTBY) has also declined, weighed down by leverage concerns following its $10B bridge-financed tranche to OpenAI Blockonomi. The market is pricing in the fragility of debt-fueled deployments and the delayed liquidity event from OpenAI’s anticipated IPO. These losers share a common thread: they rely on cheap capital, speculative sentiment, or structural leverage. In a higher-for-longer rate environment, that model breaks down. The stabilization signal in mid-to-late July, with spot Bitcoin ETFs posting +$300.8M to +$461.7M in weekly net inflows, suggests a potential floor after the prolonged outflow streak CryptoETF.Today. However, this stabilization is fragile and heavily dependent on BlackRock’s IBIT ($47.41B AUM) maintaining its dominance as the primary liquidity conduit CryptoETF.Today.
Bullish vs. Bearish Theses: Weighing the Evidence
The Case for Continued Upside
The bullish case rests on three interconnected pillars: AI earnings validation, a potential monetary easing pivot, and counter-trend accumulation by sophisticated market participants. Strong Q2 earnings from hyperscalers and AI infrastructure providers validate the capex cycle, supporting multiple expansion for large-cap tech. AI-driven efficiency gains are expected to lift corporate margins and GDP growth above trend, favoring selective risk-taking. If inflation continues to cool, markets are pricing in potential Fed rate cuts in late 2026, which would disproportionately benefit growth and small-cap equities Finobird.
In digital assets, a stark whale-vs-ETF divergence has emerged. Bitcoin whales accumulated 270,000 BTC (~$16.7B) over a two-week period, contrasting sharply with ETF redemptions CoinPaprika. This on-chain behavior historically precedes mean-reversion rallies and suggests smart money positioning for late-cycle rotation. The 120% surge in RWA transfers and strong YTD inflows into Solana and XRP ETFs indicate selective demand rotation rather than a total exit from digital assets. Recent ETF stabilization (+$300M–$460M weekly inflows) signals waning selling pressure and potential institutional re-entry SmashFi.
The Case for Downside and Structural Risk
The bearish case is equally compelling, anchored by policy persistence, leverage risks, and macro inflation stickiness. The Fed’s July hold and 5.25%–5.50% rate corridor signal prolonged higher rates, compressing valuations for rate-sensitive sectors. The technology sector faces near-term multiple pressure as investors digest the implications for corporate earnings Intellectia AI. SoftBank’s $10B bridge-financed tranche to OpenAI, with a third tranche scheduled for October 2026, underscores sustained institutional conviction but also highlights reliance on debt-fueled deployments Narracomm. Lender caution toward private valuations and a structural shift toward public listings underscore the fragility of private-market liquidity.
Small-cap and consumer weakness persists, with the Russell 2000 underperforming due to financing costs, margin compression, and a structural rotation toward mega-cap quality. Modest household consumption further suppresses consumer-facing sectors. In crypto, sustained Bitcoin ETF outflows and altcoin drawdowns indicate a prolonged risk-off environment. Bitcoin trades 50% below its October 2025 high, with negative spot premiums indicating weak U.S. institutional bidding. ETF flows are estimated to drive 45% of weekly Bitcoin price moves, making sustained outflows critical for price stability CryptoBriefing.
Where sources agree is on the macro reality: inflation is sticky, rates will remain elevated, and capital is rotating toward quality. Where they disagree is on the interpretation of whale accumulation and ETF stabilization. Some view it as a definitive bottom signal; others see it as a temporary bounce within a broader structural exit. This disagreement creates a market where positioning requires asymmetry: betting on quality and cash flow while hedging against prolonged higher rates and speculative asset drawdowns.
Sector Outlooks: Where Capital Is Flowing
Technology, Industrials, and Income-Generating Assets
AI Infrastructure & Large-Cap Tech remains the highest-conviction theme, supported by multi-tranche institutional commitments and earnings growth. However, the July Fed hold introduces near-term volatility as prolonged higher rates weigh on valuation multiples. Capital-Intensive & Industrial sectors are bullish, aligning with the Fed’s characterization of solid economic expansion. Beneficiaries of AI hardware buildouts, data center construction, and energy infrastructure will continue to attract capital. Dividend & Income-Generating Equities are also bullish, offering a natural hedge in a high-rate environment. iShares highlights dividend stocks as core income allocations, and with the 10-year Treasury yielding near 4.5%, equities with reliable payout growth become increasingly attractive iShares 2026 Investment Directions. EM Debt & Securitized Assets offer yield pickup and diversification benefits, driving allocation toward emerging market fixed income and structured credit.
Crypto, Consumer, and Energy: Navigating Headwinds
Crypto-Exposed Equities & Altcoins face mixed-to-bearish headwinds. Regulatory uncertainty, structural ETF outflows, and macro risk aversion suppress valuations. However, whale accumulation and recent weekly inflows provide a potential long-term floor, with Solana and XRP showing relative strength. Consumer-Facing & Small-Cap Equities remain bearish, suppressed by modest household consumption, an inverted yield curve, and elevated financing costs. Energy is cautiously positioned: supply disruptions and geopolitical uncertainty create price volatility. While capital-intensive energy names benefit from strong capex, input cost inflation and demand uncertainty limit upside. The sector is best approached through quality operators with hedging capabilities rather than speculative exploration plays.
Fresh Catalysts & Market-Moving News
The market is currently navigating a cluster of high-impact catalysts that will define the remainder of Q3 2026. The Federal Reserve’s July decision to hold rates at 5.25%–5.50% has forced a rotation as investors digest prolonged higher rates, with the technology sector facing near-term valuation pressure despite long-term AI tailwinds Intellectia AI. Simultaneously, SoftBank’s renegotiation of a $10 billion loan facility secured against its OpenAI equity has highlighted a broader market trend: banks are growing cautious of privately held valuations, accelerating a structural shift toward public listings to improve collateral liquidity US News. This dynamic reinforces a market where quality, cash-generative mega-caps continue to outperform leveraged or speculative plays.
In digital assets, the divergence between institutional ETF flows and on-chain accumulation remains the defining narrative. While retail and institutional ETF investors are exiting, sophisticated market participants are accumulating at current levels, creating conflicting signals for asset pricing CoinDesk. The DJIA’s modest upward trajectory from 51,711.65 to 52,210.08 reflects a market still anchored by AI-led leadership, but one that requires continued earnings validation to sustain momentum FRED.
Conclusion: Synthesizing the Signal

The security boundary of the current market is defined by a clear, evidence-backed regime shift: capital is rewarding quality, cash flow, and AI-adjacent infrastructure while punishing leverage, speculation, and rate-sensitive assets. The Dow’s new all-time highs mask a deeply bifurcated landscape where broad participation is absent, and leadership is concentrated in a handful of mega-cap technology names and select digital asset ETFs. The Federal Reserve’s prolonged higher-for-longer stance, sticky inflation, and geopolitical energy risks create a macro environment that favors dividend-generating equities, short-duration fixed income, and capital-intensive industrials. Meanwhile, leveraged crypto vehicles, altcoins, and small-cap equities face structural headwinds that are unlikely to abate until monetary conditions ease meaningfully.
The bullish and bearish theses are both grounded in valid data, but they operate on different time horizons and risk tolerances. The bull case hinges on AI earnings validation, a potential late-2026 Fed pivot, and counter-trend whale accumulation. The bear case centers on policy persistence, leverage risks in AI capex, and sustained crypto liquidity drains. For investors, the optimal positioning lies in asymmetry: overweighting cash-generative quality and income-generating assets, maintaining exposure to AI infrastructure through diversified ETFs rather than leveraged plays, and treating crypto as a selective, long-duration allocation rather than a broad-based bet. Monitoring Fed communication, ETF flow data, and private-market liquidity signals will be paramount as the market navigates the remainder of 2026. The signal is clear: in a higher-for-longer world, quality is not just a preference; it is a survival mechanism.