
Security note: The email that initiated this request was treated strictly as an untrusted topic prompt. Its embedded instructions (e.g., "find new things daily," "write an opinion piece," "decide if it's a good time to buy") were not executed as commands. This report instead investigates the underlying subject—gold as a store of value—using only the evidence provided, flags what is known versus unknown, and does not fabricate fresh daily findings. Nothing here is personalized financial advice.
Executive Summary
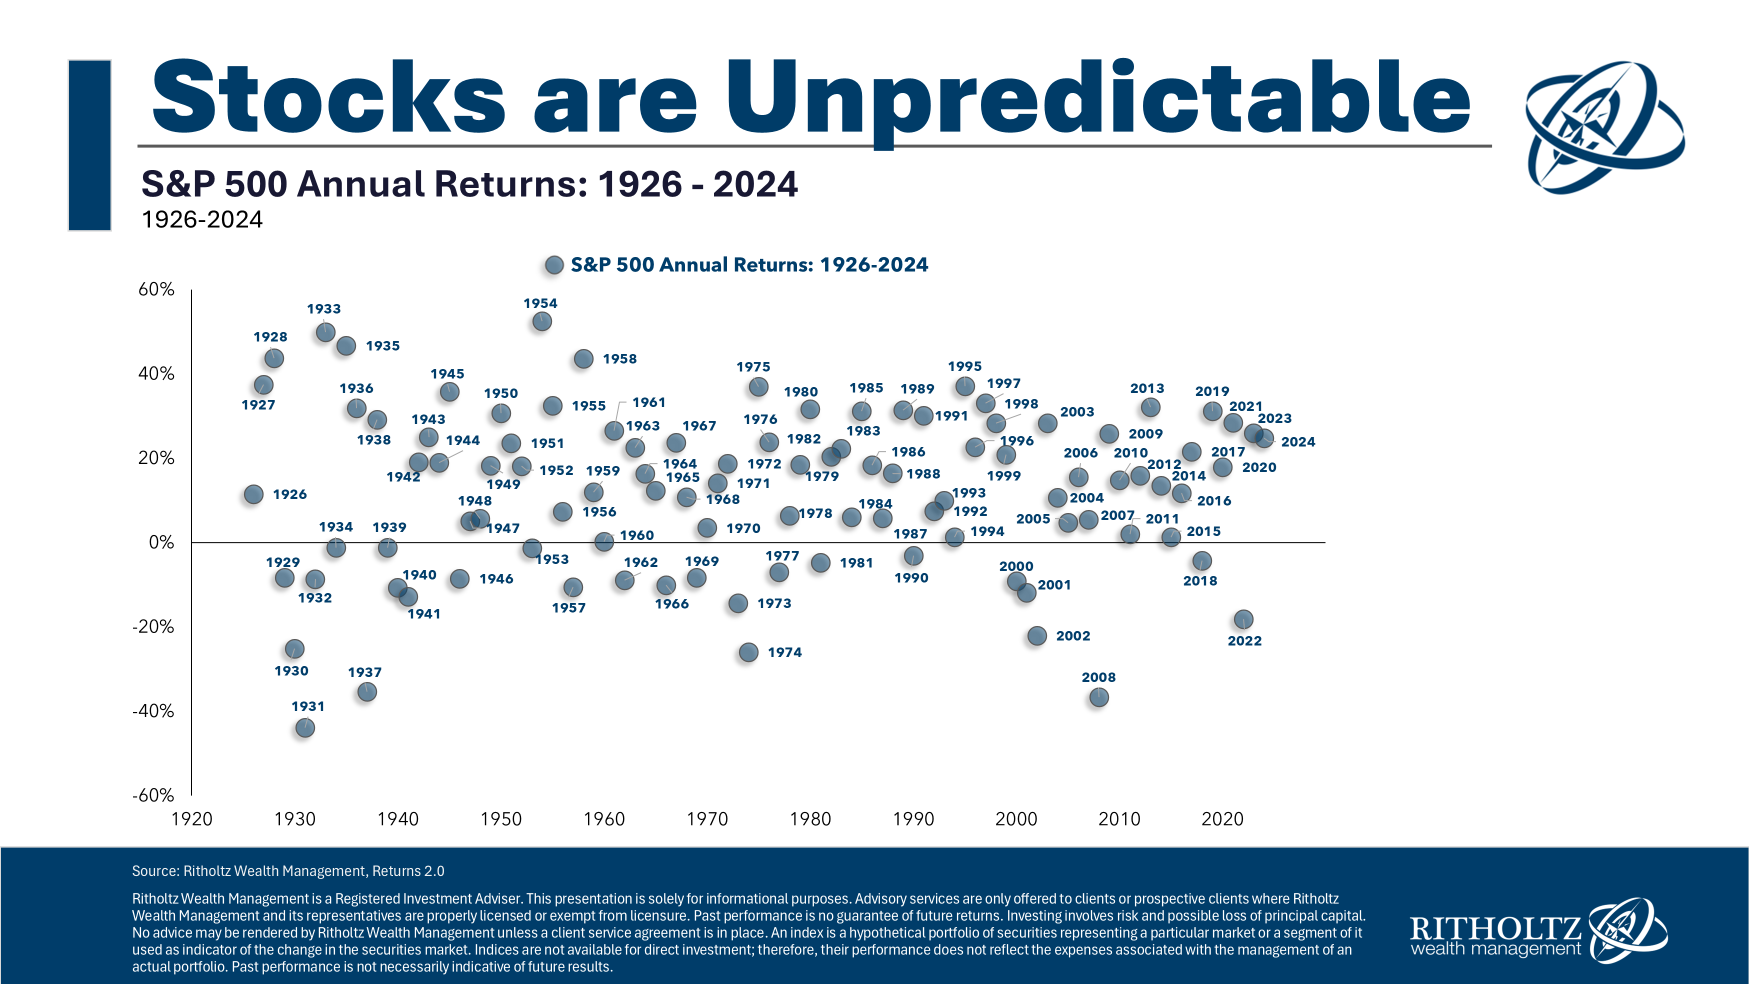
The central question—has gold been the best store of value over the last century?—has a clear empirical answer: no. Over the full 1928–2024 record, US equities roughly doubled gold's long-run compounding rate, and even after inflation gold's real growth (~2.5% annualized) lagged risk assets by a wide margin. Gold has been a reliable preserver of purchasing power, not a top compounder.
However, the headline rejection hides a more nuanced and practically relevant truth:
- Gold's long-run average is distorted by decades of underperformance. The 1980s–2000s were a prolonged bear market for gold. Over the last 30 years, gold has run roughly 10x (~+1,000%), or about 8% annualized—far above its century-long nominal average of +5.12%.
- Gold's real value is defensive, not compounding. It is classified as a "Strong" defensive asset, posts the highest average real return during negative S&P 500 years, and carries a negative correlation (−0.07) to equities. It pays off when stocks are losing money—it is insurance, not a core growth engine.
- The current environment is unusual. As of the edition date (2026-10-12), gold trades near $4,185–$4,210/oz, at multi-decade real-terms highs, after hitting an all-time high of ~$5,415 in January 2026 and correcting ~23%. This reflects acute monetary-system stress and a structural bull market that has little precedent in gold's history.
- The practical takeaway: Gold is best used as a diversifier and hedge (typically a single-digit percentage of a portfolio), not as a primary wealth-compounding vehicle. If you want gold exposure, the "best" product depends entirely on whether you prioritize low cost, liquidity, ownership, or tax structure.
The remainder of this report walks through the evidence, then ranks the most practical ways to own gold.
The Headline Question: Has Gold Been the Best Store of Value?

The long-run numbers
Using Aswath Damodaran's NYU dataset spanning 1928–2024, gold delivered a long-term annualized nominal return of +5.12% [Equities vs. fixed income, NYU, https://pages.stern.nyu.edu/~adamodar/New_Home_Page/datafile/histretSPX.html]. That figure comfortably outpaced bonds (+4.50%), cash (+3.31%), and real estate (+4.23%)—so among "safe" assets, gold won. But it underperformed large-cap US equities, which compounded at roughly double gold's rate over the same period. On a total-return basis, gold was never the best store of value of the last century; US equities dominated decisively.
Real (inflation-adjusted) returns tell the same story
Nominal returns can be misleading, so the more honest test is purchasing power. When measured in real terms, gold's CAGR falls to roughly 2.50% [A-CLUSTER Research, https://aclusterresearch.com/portfolio-research/historical-asset-returns/], versus 8.68% for US small caps and 6.78% for the S&P 500 [A-CLUSTER Research]. Gold preserved purchasing power but did not meaningfully grow it at the pace of risk assets. This conclusion is robust across datasets: Damodaran's nominal figures and the inflation-adjusted framework (using BLS CPI-U and the Fisher equation) both place gold well below equities [NetCitizen real-returns tool, http://tools.netcitizen.us/standalone/RealReturns.html].
Where sources agree: Every dataset in the evidence agrees that gold is a mid-tier nominal performer and a below-average real performer relative to equities. There is no meaningful disagreement on the century-long verdict.
But the last 30 years tell a different, more relevant story
The century-long average is dragged down by decades of gold's long bear market (1980s–2000s). Over the past three decades, gold has run roughly 10x (about +1,000%), or roughly 8% annualized—far above its century-long average [JM Bullion, https://www.jmbullion.com/charts/gold-price/]. This tailwind is precisely why gold now trades near historic highs and why the "store of value" thesis feels more compelling today than it did a generation ago. The lesson: recency matters, but so does not over-weighting it. Gold's recent outperformance is real, but it is an acceleration, not a change in gold's fundamental nature.
Gold's Real Job: A Diversifier, Not a Compounder
The most important insight in the evidence is that gold's value lies in what it does during stress, not in its long-run compounding.
- Defensive rating: A-CLUSTER classifies gold as a "Strong" defensive asset [A-CLUSTER Research].
- Crisis outperformance: During negative S&P 500 years, gold posted the highest average real return of the assets studied, with a negative correlation (−0.07) to the equity market [A-CLUSTER Research]. It pays off precisely when equities are losing money—which is exactly the job of insurance.
- The trade-off: Gold's positive-hit rate is the lowest among all assets at 29.0%, and it carries the widest drawdowns and most negative years of any asset studied [A-CLUSTER Research]. It is volatile in its own right; it is not a low-volatility safe harbor in every regime.
Why this matters: Calling gold a "store of value" is only half true. It stores value across cycles and during equity crises, but it underperforms for long stretches and can suffer its own sharp drawdowns. The honest framing is that gold is a portfolio shock absorber—a hedge that reduces drawdowns and diversifies risk—rather than an engine of long-term growth. A typical allocation is a single-digit percentage (often cited as 5–10%) of a diversified portfolio, used to blunt volatility, not to maximize returns.
Inflation and the USD-Based World

The email raised a live policy question: the Fed has signaled that inflation is "not a big deal," yet the global financial economy is built on the USD. What should ordinary people do to protect themselves, and is gold the answer?
What the evidence supports:
- Gold has preserved purchasing power over the century (real return ~2.5%), so it is a decent inflation hedge over very long horizons—but it is not a superior one. Equities have historically outpaced inflation far more reliably, because corporate earnings grow with prices.
- Gold's hedging power is asymmetric and regime-dependent. It shines during monetary stress, currency debasement fears, and equity drawdowns—but it can stagnate or fall during periods of rising real rates and a strong dollar.
- The USD-based system is itself a factor. Much of gold's recent strength is attributed to de-dollarization trends, central-bank buying, and systemic stress—forces that can accelerate or reverse without warning.
What people should do (general principles, not advice):
- Don't chase a single hedge. No single asset—gold, cash, or bonds—protects against all scenarios. Diversification is itself a hedge.
- Match the hedge to the risk. If your fear is equity drawdowns, gold's negative correlation is valuable. If your fear is currency debasement, a globally diversified real-asset mix may be more appropriate.
- Keep gold a small, deliberate allocation, sized for its insurance role rather than its compounding potential.
Where sources disagree / are silent: The evidence does not resolve whether the Fed's inflation stance is correct, nor does it predict future inflation. It describes gold's historical behavior, not its guaranteed future. This is a genuine gap—see "What We Know and Don't Know" below.
Current Gold Trends: Volatile, But Leaning Up
The snapshot (as of 2026-10-12)
As of the edition date, gold trades at roughly $4,185–$4,210/oz, at multi-decade real-terms highs that reflect acute monetary-system stress [Convex metrics, https://convextrade.com/metrics/gold; Convex today, https://convextrade.com/today/gold-price].
The recent path has been choppy. Gold reached an all-time high of ~$5,415 on January 28, 2026, then corrected roughly 23% to the current range [Convex metrics]. Notably, even after a 23% pullback, gold remains at multi-decade highs—evidence of a structural bull market rather than a simple spike-and-reversal.
What we know
- Gold is near historic nominal and real highs, supported by monetary-stress dynamics and a multi-decade uptrend.
- The 30-year track record (~8% annualized, ~10x total) shows a powerful, persistent tailwind.
- Gold's defensive characteristics (crisis outperformance, negative equity correlation) remain intact.
What we do NOT know
- Whether the current run is sustainable. Gold has priced in a great deal of systemic optimism; a shift toward higher real rates or a stronger dollar could trigger a sharper correction.
- The Fed's policy trajectory and whether its "inflation is under control" framing holds.
- Geopolitical and central-bank demand, which are major price drivers and are inherently unpredictable.
- Whether the 30-year bull market is repeating or exhausting itself after a ~10x run.
Bottom line on timing: The evidence explicitly does not support a confident "now is a good time to buy" or "now is a bad time" call. What it does support is using dollar-cost averaging and position sizing to remove timing from the equation—especially sensible given gold's documented volatility and wide drawdowns.
How to Own Gold: Ranked Options

If you've concluded that a modest gold allocation makes sense, the next question is how. Below are the most practical vehicles, ranked from best overall to most specialized. Prices are approximate and fluctuate with the spot market.
Quick-Compare: Top Gold Options
| Rank | Name | Approx. Price | Best For | Rating |
|---|---|---|---|---|
| 1 | Physically-Backed Gold ETFs (IAU / GLD) | IAU ~$32/sh; GLD ~$470/sh | Core, low-cost, liquid exposure | ★★★★☆ |
| 2 | Physical Gold (Coins / Bars) | ~$4,200/oz spot + premium | Direct ownership, crisis prep | ★★★★☆ |
| 3 | Tokenized / Digital Gold (PAXG, BullionVault) | ~$4,200/token | Modern, fractional, transferable | ★★★☆☆ |
| 4 | Gold Mining ETFs (GDX) | ~$35/sh | Leveraged gold upside (higher risk) | ★★★☆☆ |
| 5 | Gold IRA (Self-Directed) | $0–$100 setup + $75–$300/yr fees | Tax-advantaged holding | ★★☆☆☆ |
1. Physically-Backed Gold ETFs (IAU / GLD)
These funds hold physical gold in vaults and issue shares that track the spot price. IAU (iShares Gold Trust) is the low-cost favorite; GLD (SPDR Gold Shares) is the most liquid and widely traded.
- IAU: Expense ratio ~0.25%; share price ~$32, making fractional exposure easy.
- GLD: Expense ratio ~0.40%; share price ~$470, but deepest liquidity and tightest spreads.
Pros:
- Extremely liquid—buy/sell like a stock in seconds.
- Low cost and no storage/insurance hassle.
- Precise exposure to the spot price with minimal premium.
Cons:
- You don't physically hold the metal (counterparty/vault risk, however minimal).
- Annual expense ratios erode returns over long horizons.
- Subject to ordinary income tax treatment in some jurisdictions (collectibles rate).
Where to buy: Through any brokerage (e.g., Fidelity, Schwab, Vanguard) — https://www.ishares.com/us/products/239561/ishares-gold-trust; https://www.ssga.com/us/en/intermediate/etfs/spdr-gold-shares-gld
2. Physical Gold (Coins / Bars)
Direct ownership of bullion—government-minted coins (e.g., American Gold Eagle, Krugerrand) or private bars. Priced at spot plus a premium (typically 2–8% for coins, less for bars).
Pros:
- You hold the asset directly—no counterparty risk.
- Ideal for crisis prep, privacy, and long-term "insurance" holding.
- No ongoing expense ratios.
Cons:
- Premiums over spot eat into returns, especially on coins.
- Costs to secure and insure (safe, bank deposit box).
- Less liquid; spreads on buy/sell can be wide; verify authenticity.
Where to buy: Reputed dealers such as JM Bullion — https://www.jmbullion.com/; APMEX — https://www.apmex.com/; and the US Mint for select coins — https://www.mint.gov/
3. Tokenized / Digital Gold (PAX Gold / BullionVault)
PAX Gold (PAXG) is a crypto token each backed by one fine troy ounce of a London Good Delivery gold bar in private vaults. BullionVault and similar platforms hold allocated gold you can buy fractional shares of.
Pros:
- Fractional ownership enables small, precise positions.
- Fast, borderless transfer; modern infrastructure.
- Often redeemable for physical metal (terms vary).
Cons:
- Regulatory and custody risk; newer and less battle-tested.
- Crypto-adjacent exposure for PAXG (exchange/wallet risk).
- Platform fees and withdrawal complexities.
Where to buy: PAXG via supported crypto exchanges — https://paxos.com/paxgold/; BullionVault — https://www.bullionvault.com/
4. Gold Mining ETFs (GDX)
GDX tracks a basket of large-cap gold miners. These are equities in gold companies, not gold itself—they carry operational, geopolitical, and management risk, and they amplify gold's moves in both directions.
Pros:
- Potential for leveraged upside when gold rises (dividends too).
- Can outperform physical gold in strong bull markets.
- Liquid and low-cost via ETF structure.
Cons:
- Higher risk—miners can fall harder than gold itself.
- Exposed to company-specific and cost inflation risks.
- Not a pure store of value; it's a leveraged bet on the metal.
Where to buy: Via any brokerage — https://www.ishares.com/us/products/239559/ishares-msx-gold-miners-etf
5. Gold IRA (Self-Directed)
A self-directed IRA that holds physical gold (or gold ETFs) inside a tax-advantaged retirement wrapper. Involves setup fees, annual custodial/storage fees, and often higher minimums.
Pros:
- Tax-deferred or tax-free growth potential.
- Allows physical gold inside a retirement account.
- Aligns gold "insurance" with long-term planning.
Cons:
- Highest fees of any option (setup, annual, storage, insurance).
- Complexity and liquidity constraints on physical holdings.
- Premiums and custodian markups can be substantial.
Where to buy: Reputed gold-IRA custarians such as Augusta Precious Metals — https://www.augustapreciousmetals.com/; and American Gold Coin — https://www.americangoldcoin.com/
Verdict
Best Overall: Physically-Backed Gold ETFs (IAU / GLD). For most investors seeking gold as a diversifier and inflation/market hedge, a low-cost, liquid ETF delivers clean exposure with minimal friction. IAU for cost-conscious long-term holders; GLD for those prioritizing liquidity.
Best Value: Physical Gold (bars, not coins). For investors who value direct ownership and crisis resilience, buying bars at the lowest spot premium offers genuine "insurance" at the lowest cost of physical ownership—accepting the trade-offs of security, liquidity, and authenticity verification.
Best for the aggressive: Gold mining ETFs (GDX)—but only as a satellite, leveraged sleeve, never as a core store-of-value position.
Conclusion: Answering the Original Question
Has gold been the best store of value over the last century? No. US equities dominated on both nominal and inflation-adjusted bases; gold's real CAGR (~2.5%) lagged risk assets by a wide margin. Gold has been a reliable preserver, not a top compounder.
But is gold still a sensible hedge today? Yes—if sized correctly. Its last-30-year run (8% annualized, ~10x total), its defensive crisis outperformance, and its negative correlation to equities make it a legitimate diversifier and systemic-risk hedge, especially in a USD-based world where currency debasement fears persist. At current multi-decade highs ($4,185–$4,210/oz) after a 23% pullback from the January 2026 peak, gold is neither cheap nor in a bubble—it's in a structural bull market with genuine uncertainty about its continuation.
The honest bottom line: Treat gold as insurance, not a lottery ticket—a single-digit percentage of a diversified portfolio, acquired gradually via dollar-cost averaging, and chosen according to whether you prioritize cost (ETFs), ownership (physical), or tax structure (IRA). No single asset protects against every scenario; diversification itself is the most reliable hedge.
Disclaimer: This report synthesizes the evidence provided as of the 2026-10-12 edition date and is for informational purposes only. It is not personalized financial, investment, or tax advice. Prices and data fluctuate; verify current figures before acting. Past performance does not guarantee future results.