
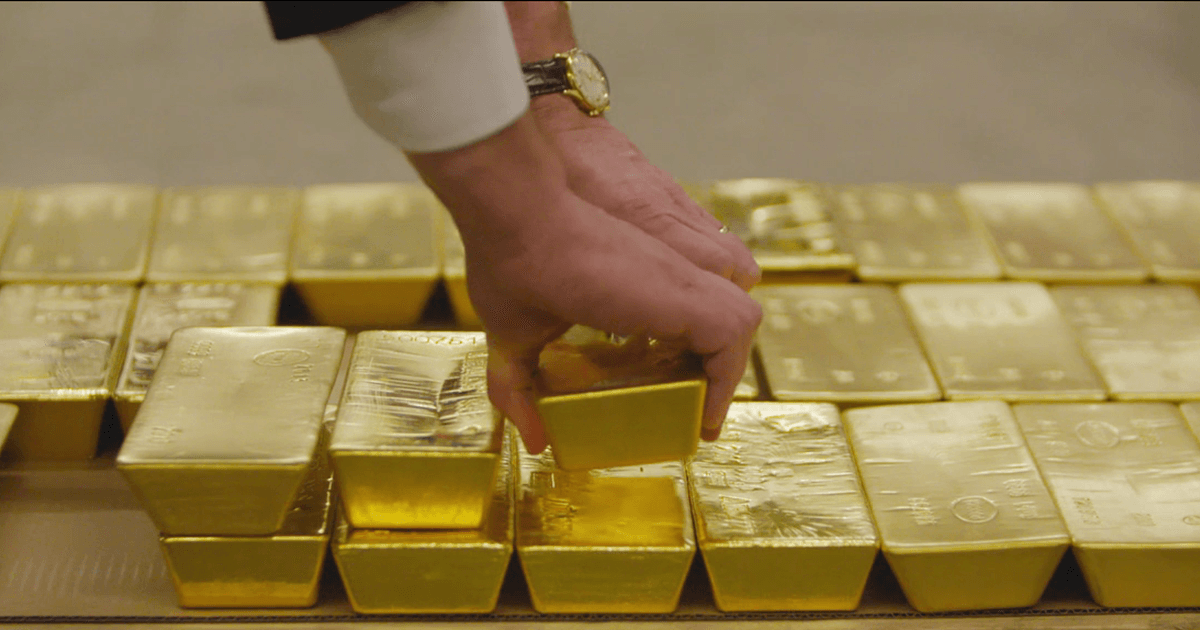
Executive Summary
The premise that gold has been "the best store of value for the last century" does not survive contact with the data. Over the full century, gold preserved purchasing power and beat bonds, cash, and real estate, but it was consistently outperformed by equities—returning roughly +5.12% annually from 1928–2024 versus +9.94% for large-cap stocks. Source Gold's genuine edge is episodic, not continuous: it excels during high inflation, negative real interest rates, dollar devaluation, and institutional distrust, and it functions as portfolio insurance during equity crises. It is best understood as defensive insurance, not a top-tier long-term return generator.
Against the Fed's "inflation is under control" framing, gold is a partial but imperfect shield. It preserves purchasing power over long horizons but does not track inflation year-to-year—2022 proved this painfully, when gold went essentially flat in USD terms despite 8.5% inflation. Because the global financial system is built on the USD, gold is a legitimate structural hedge against dollar debasement, but it is one tool among several, not a standalone answer.
The current market is historic and frothy at once: gold hit an all-time high of $5,589.38 on January 28, 2026, corrected ~20% to ~$4,300 by mid-year, and trades around $4,193–4,216 as of October 11, 2026. The rally is driven primarily by structural central-bank buying and de-dollarization, and the traditional real-yield pricing model that governed gold for two decades appears to have broken down after 2022. Source Whether it is a good time to buy depends on the role gold plays in your portfolio—not on gold's standalone track record. Below, I synthesize the evidence and then rank the actual ways to gain exposure.
The Research: Has Gold Been the Best Store of Value Over the Last Century?

Short answer: no. Gold has been a reliable preserver of value, but not a consistent top performer.
From 1928 to 2024, gold returned +5.12% annually, comfortably outpacing bonds (+4.50%), cash (+3.31%), and real estate (+4.23%), but it trailed large-cap stocks (+9.94%) and small caps (+11.74%, with liquidity caveats). Source Over the full century (1926–2025), $1 in gold grew to roughly $5.35 in real terms—modest compared to equities. Source BullionVault data (1974–2023) shows gold topped US asset performance only 5 times, trailing US equities (9 times), silver (9 times), and REITs (11 times). Source
The lesson is that asset-class leaders rotate by regime. Over the last 50 years, the S&P 500 has outperformed gold in both nominal and inflation-adjusted terms, making stocks superior for long-term compounding. Source The CME's century-scale analysis frames this as six distinct eras since 1929: equities dominate during stability, disinflation, and growth; gold tends to outperform during instability. Source
So when does gold actually win? Its strongest returns coincide with high inflation, negative real interest rates, and declining confidence in paper currency. In the 1970s, after Nixon ended the gold standard in 1971, gold rose roughly 500% in real terms during the high-inflation decade while stocks and bonds struggled. Source Gold also held its own or beat the S&P 500 from 2001–2025, including during the Great Recession and the COVID-19 pandemic. Source The 1980s–1990s disinflation era told the opposite story: with money stable and safe assets offering real income, gold stagnated. Source
A striking data point underscores this: gold's 1980 inflation-crisis peak of roughly $850/oz remained the all-time high in real (inflation-adjusted) terms until January 2026, when the current cycle broke it. Source In other words, gold's most powerful value-preservation episodes are concentrated in monetary-stress periods, not spread evenly across time.
The 2026 Backdrop: Inflation, the Fed, and the USD
The Fed defines inflation as the rate at which prices rise over time, operates under a dual mandate of maximum employment and stable prices, and targets a 2% inflation rate measured by the PCE price index, preferring PCE over CPI because it adapts faster to changing spending patterns. Source The Fed's July 2026 Monetary Policy Report projects a path back toward that 2% goal, reinforcing the official framing that inflation is a manageable, transient challenge. Source
The empirical data tells a more nuanced story. Headline CPI ran +3.4% year-over-year as of August 2026, having peaked at 4.17% in May 2026 before easing to ~3.35%. Source Source Core CPI sat near target at +2.4%, but wages are lagging prices—average hourly earnings rose only ~+$0.05 in September, below price gains, eroding real purchasing power even as headline disinflation is reported. Source This gap between the Fed's 2% PCE narrative and the 3.4% headline reality is precisely the environment in which the gold-as-protection thesis gains appeal.
Two structural forces are reshaping gold's role. First, dollar devaluation: the USD's reserve share has fallen to roughly 57%, down from 72% in 2000—a shift analysts call a "regime change in reserve asset allocation." Source Commentators like Rick Rule (projecting up to a 75% loss in USD purchasing power over a decade) and Eric Sprott frame gold as a structural hedge against currency debasement and rising government debt. Source Second, central-bank buying has become the dominant driver—official-sector purchases absorbed roughly a quarter of annual mine output every year since 2022, with ~850 tonnes bought in 2025 alone. Source
Critically, the real-yield pricing model broke down after 2022. Gold's correlation with TIPS yields fell from −0.73 to −0.07 that year, effectively zeroing out the traditional inverse relationship between real yields and gold's price. Source This means gold can no longer be predicted by rate expectations alone—official-sector demand is one-sided, largely price-insensitive, and largely invisible in real-time data, creating a durable price floor but also attribution risk.
How to Protect Yourself: Ranked Gold Investment Options

The research answers whether gold belongs in a portfolio; the harder question is how to own it. Below I rank the practical options, from lowest-friction to most hands-on. Prices are approximate as of the October 2026 backdrop and move with spot gold (~$4,200/oz).
| Rank | Product | Approx. Price | Best For | Rating |
|---|---|---|---|---|
| 1 | Low-cost Gold ETF (IAU / GLD) | IAU ~$420 / GLD ~$450 per share | Ease, liquidity, cost | ★★★★☆ |
| 2 | Physical Gold Coins & Bars (home/allocated) | ~$4,200+spot (coins carry premiums) | Tail-risk insurance, control | ★★★★★ |
| 3 | Gold Miners ETF (GDX) | ~$42 per share | Growth leverage, dividends | ★★★☆☆ |
| 4 | Gold IRA | $0–150 setup + $100–300/yr storage | Tax-advantaged retirement | ★★★★☆ |
| 5 | Allocated / Digital Gold (PAXG) | ~$4,200 per token | Fractional, tech-savvy | ★★★☆☆ |
| 6 | Gold Savings & DCA Apps (BullionVault) | ~$4,200/oz + ~0.5% storage | Dollar-cost averaging | ★★★★☆ |
1. Low-cost Gold ETF (IAU / GLD)
A gold ETF holds physical bullion in secure vaults and trades like a stock, giving you price exposure without the burden of storing metal. iShares Gold Trust (IAU) charges a 0.25% expense ratio; SPDR Gold Shares (GLD), the larger and more liquid vehicle, charges 0.40%. Source At ~$4,200/oz, each share represents roughly one-tenth of an ounce.
Pros: Instant liquidity, tiny spreads, no storage or insurance hassle, easy to buy inside retirement accounts, and IAU is among the cheapest ways to own the metal. Cons: You don't physically hold the asset (counterparty and custodial risk), annual fees quietly erode returns over decades, and it offers no protection if the financial system itself seizes up. Where to buy: iShares IAU · SPDR GLD
2. Physical Gold Coins & Bars (Home Storage or Allocated)
Owning the actual metal—American Gold Eagles, Maple Leafs, or investment bars—is the purest expression of gold as insurance against systemic risk. Reputable dealers include APMEX, JM Bullion, and SD Bullion. Source Home storage means you hold it directly; allocated storage (through a vault) means it's segregated and insured but costs fees.
Pros: True ownership with zero counterparty risk, no ongoing management fees (if stored at home), and maximal protection in a severe currency or systemic crisis—the exact scenario gold is meant to hedge. Cons: You pay spot-plus premiums (coins often run 3–8% over spot), you bear security and insurance responsibilities, spreads on buy/sell are wide, and authenticity/counterfeit risk exists if you buy from untrusted sources. Where to buy: APMEX · JM Bullion · SD Bullion
3. Gold Miners ETF (GDX)
Rather than owning gold, you own the companies that mine it. The VanEck Gold Miners ETF (GDX) holds the largest gold mining firms and provides leveraged exposure to the metal's price—plus dividends. [Source](https