
Let me analyze this task carefully. The user has provided a research report task that involves updating an evolving research report by integrating new findings (Findings 5-10) into the existing report.
First, let me note the security consideration: The original email is flagged as untrusted, but the actual task is legitimate financial research about gold as a store of value and inflation hedge. There's nothing harmful here—it's just asking me to research and write about gold investment. This is a legitimate task.
Now let me look at the current report structure and the new findings.
Current report sections:
- Has Gold Been the Best Store of Value Over the Last Century?
- Gold's Track Record Is Regime-Dependent
- Gold as an Inflation Hedge
- Protecting Purchasing Power in a USD-Based System
- Current Gold Trends (2026)
- What We Know and What We Don't
- Bottom Line
New findings (5-10):
- Finding 5 (GoldRadar): $4,193.94/oz, up 1.22% on day, 24K gold $134.84/gram. Live snapshot only.
- Finding 6 (150currency): $4,194.17/oz, up 1.20%, +138.51% over 5 years, +231.98% over 10 years, -5.27% over 30 days, -12.81% over 6 months. Surge toward $5,000-$5,400 range. Drivers: central bank buying, persistent global inflation, scarcity loop with flat mine production (1-2% growth), import tariffs. Premiums elevated.
- Finding 7 (150currency): ~$4,193.24/oz, up 1.17%, peaked near $4,424.78 on Sep 9 2026 before pulling back. +6.05% over 1 year, +138.51% over 5 years, +231.98% over 10 years.
- Finding 8 (Gold Ticker Live): $4,191.73/oz, up 1.41%, +1.31% over week, -4.96% over month, -11.81% over six months (from January 2026 high of $4,753.00). +25.50% over one year, +131.84% over five years. Gold/silver ratio 69.3. Driver: cracking dollar rally.
- Finding 9 (World Gold Council): Central banks net buyers in May 2026 (+41t), led by Poland, China, Uzbekistan, Kazakhstan, Singapore. 45% expect own reserves to rise, 89% expect global reserves to grow. Bank of Korea preparing gold ETF exposure. Latin America new buying (Chile, Guatemala, Bolivia, Uruguay).
- Finding 10 (World Gold Council): Central bank buying rebounded sharply in Q2 2026 to record 289t (fivefold jump from Q1's 57t), led by Poland (51t, nearing 700t target) and China (33t). Weak H1 2026 (345t, lowest since 2022) driven by Q1 selling from Turkey, Russia, Azerbaijan. 89% expect global reserves to rise, 45% plan to increase holdings.
Now, the current report already has data from Findings 1-4. Let me note the existing price data in the report:
- Section 5 says: "gold trades near multi-decade real-terms highs of approximately $4,100–4,225/oz (e.g., ~$4,117 on Oct 8; ~$4,176–4,225 on Oct 9)"
- 12-month high near $5,595, January 2026 real all-time high of $5,589.38, April 2026 peak ~$4,722
- Down ~5-7% past month, ~12% six months, up ~5.5% YoY, up ~25% since early 2025
- +135% from Oct 2022 low of $1,656.43
The new findings add:
- More price confirmations (~$4,190-4,195/oz range)
- +138.51% over 5 years, +231.98% over 10 years
- Peak near $4,424.78 on Sep 9 2026 (Finding 7) — this is a NEW data point that differs from the April 2026 peak of $4,722 mentioned in the report
- January 2026 high of $4,753.00 (Finding 8) — this is close to the $5,589 January real all-time high mentioned in the report but different
- Surge toward $5,000-$5,400 range (Finding 6)
- Scarcity loop with flat mine production (1-2% growth), import tariffs (Finding 6)
- Elevated premiums for retail buyers (Finding 6)
- Gold/silver ratio ~69.3-69.4 (Findings 4, 8)
- Central bank buying details: Q2 2026 record 289t, Poland nearing 700t target, China 33t (Findings 9, 10)
- Bank of Korea gold ETF exposure, Latin America buying (Finding 9)
- Weak H1 2026 (345t, lowest since 2022) driven by Turkey, Russia, Azerbaijan selling (Finding 10)
- Cracking dollar rally as driver (Finding 8)
Now I need to reconcile some contradictions:
Peak prices: The report mentions:
- 12-month high near $5,595 (Tindex)
- January 2026 real all-time high of $5,589.38 (KITCO)
- April 2026 peak ~$4,722 (Convex)
New findings mention:
- Peak near $4,424.78 on Sep 9 2026 (Finding 7)
- January 2026 high of $4,753.00 (Finding 8)
These are somewhat inconsistent. The Tindex/KITCO figures ($5,589-5,595) are higher than the Gold Ticker Live January 2026 high of $4,753. And Finding 7 says gold peaked near $4,424.78 on Sep 9 2026.
Hmm, there's a discrepancy here. Let me think about how to reconcile. The different sources may be measuring different things (spot vs. futures, different contracts, different time zones). I should present the range and note the volatility. The most authoritative-sounding figures are the ~$5,590 peak (Tindex 12-month high, KITCO January real all-time high). But Gold Ticker Live says January 2026 high of $4,753.
Actually, I think the safest approach is to note that gold has been highly volatile in 2026, with various sources citing peaks in the $4,400-$5,600 range depending on the exact date and contract, and current prices around $4,190-4,225. I'll present the higher peak figures as the recent highs and note the pullback.
Actually, let me be careful. The report already cites the $5,589.38 January 2026 real all-time high and $5,595 12-month high. The new findings add a January 2026 high of $4,753 (Gold Ticker Live) and a Sep 9 peak of $4,424.78 (150currency).
I think I should present this as: gold has traded in a wide, volatile range throughout 2026, with sources citing peaks ranging from ~$4,425 (September) to ~$4,753 (January) to a 12-month high near $5,590. Current prices have consolidated to ~$4,190-4,225. I'll note the discrepancy in sources without over-committing to one.
Actually, to keep it clean, I'll say gold peaked in the $4,700-5,600 range in early 2026 (with sources citing a January 2026 high near $4,753 and a 12-month high near $5,590), pulled back to ~$4,425 by September, and has since consolidated to ~$4,190-4,225. This captures the volatility and the pullback.
Central bank buying: The report says "4,000+ tons, 2022–2025; 1,100+ tonnes in 2025 alone." New findings add:
- Q2 2026 record 289t (fivefold jump from Q1's 57t)
- Weak H1 2026 (345t, lowest since 2022) driven by Q1 selling from Turkey, Russia, Azerbaijan
- Poland nearing 700t target, China 33t
- 45% expect own reserves to rise, 89% expect global reserves to grow
- Bank of Korea gold ETF exposure, Latin America buying
This is great detail to add. I should note the Q2 2026 rebound and the H1 weakness, plus the survey sentiment.
New drivers:
- Scarcity loop with flat mine production (1-2% growth) (Finding 6)
- Import tariffs (Finding 6)
- Elevated premiums for retail buyers (Finding 6)
- Cracking dollar rally (Finding 8)
- Gold/silver ratio ~69.3-69.4
These add nuance to the drivers section.
Long-term performance:
- +138.51% over 5 years, +231.98% over 10 years (Findings 6, 7)
- +131.84% over five years (Finding 8)
- +6.05% over 1 year (Finding 7), +25.50% over one year (Finding 8)
These add to the store-of-value narrative.
Now let me think about how to integrate all this. The report is already well-structured. I'll integrate the new findings into the existing sections:
Section 1 (Best Store of Value): Add the long-term performance data (+138.51% over 5 years, +231.98% over 10 years). Maybe add the gold/silver ratio.
Section 2 (Regime-Dependent): Not much new here. Maybe leave as is.
Section 3 (Inflation Hedge): Not much new. Leave as is.
Section 4 (Protecting Purchasing Power): Add the debasement thesis details. Maybe add the scarcity loop and tariffs.
Section 5 (Current Trends): This is the big update. Add:
- More price confirmations (~$4,190-4,225)
- Long-term performance (+138.51% over 5 years, +231.98% over 10 years)
- Peak price reconciliation
- Gold/silver ratio
- New drivers (scarcity loop, tariffs, dollar)
- Central bank buying details (Q2 2026 record 289t, H1 weakness, Poland/China, survey sentiment)
- Elevated premiums for retail buyers
Section 6 (What We Know/Don't): Update with new data points.
Section 7 (Bottom Line): Update.
Let me also handle the central bank buying numbers. The report says "4,000+ tons, 2022–2025; 1,100+ tonnes in 2025 alone." The new findings say Q2 2026 was a record 289t. So the total for 2022-2025 plus Q2 2026 would be 4,000+ tons. Let me keep the existing figures and add the 2026 detail.
Wait, there's a potential inconsistency. The report says "1,100+ tonnes in 2025 alone." But Finding 10 says H1 2026 was 345t, the lowest since 2022. And Finding 9 says May 2026 was +41t. These are consistent with a slowdown in 2026 H1 followed by a Q2 rebound. Actually, Finding 10 says Q2 2026 was a record 289t, which is a fivefold jump from Q1's 57t. So H1 2026 = 57t (Q1) + 289t (Q2) = 346t ≈ 345t. That's consistent.
Hmm wait, but if Q1 was 57t and Q2 was 289t, that's 346t for H1, which matches the "345t" figure. Good. And the weak H1 was "driven by Q1 selling from Turkey, Russia and Azerbaijan." So Q1 had net selling from those countries, which is why Q1 was so low (57t). Then Q2 rebounded.
OK so the central bank narrative is: strong 2022-2025 (4,000+ tons), weak H1 2026 (345t, lowest since 2022) due to Q1 selling from Turkey/Russia/Azerbaijan, then a Q2 2026 record rebound (289t). Sentiment remains strong (45% plan to increase holdings, 89% expect global reserves to grow).
Let me integrate this.
Now let me think about the price reconciliation more carefully. The report currently says:
- Current price: ~$4,100-4,225/oz (Oct 8-9 2026)
- 12-month high: $5,595
- January 2026 real all-time high: $5,589.38
- April 2026 peak: ~$4,722
- Down ~5-7% past month, ~12% six months, up ~5.5% YoY, up ~25% since early 2025
- +135% from Oct 2022 low of $1,656.43
New findings add:
- Current: ~$4,190-4,225/oz (multiple sources)
- +138.51% over 5 years, +231.98% over 10 years
- Peak near $4,424.78 on Sep 9 2026 (Finding 7)
- January 2026 high of $4,753.00 (Finding 8)
- Surge toward $5,000-$5,400 range (Finding 6)
- Gold/silver ratio ~69.3-69.4
So the peak prices are a bit inconsistent across sources. Let me present a range. The report's $5,589-5,595 peak (January 2026) is the highest. Gold Ticker Live says January 2026 high of $4,753. 150currency says Sep 9 peak of $4,424.78.
I think the cleanest approach: gold has traded in a wide, volatile range throughout 2026. Sources cite peaks ranging from ~$4,425 (September 2026) to ~$4,753 (January 2026) to a 12-month high near $5,590 (with a January 2026 real all-time high of $5,589.38). Current prices have consolidated to ~$4,190-4,225. I'll note that the exact peak varies by source and contract.
Actually, I realize I should be careful not to overcomplicate. Let me present the key facts:
- Current: ~$4,190-4,225/oz (Oct 9 2026)
- From Oct 2022 low ($1,656.43): +135-139%
- Over 5 years: +138.51%
- Over 10 years: +231.98%
- Past month: -5 to -7%
- Past six months: -12 to -13%
- YoY: +2-6%
- Since early 2025: +25%
- 2026 peaks: sources cite ~$4,425 (September) to ~$4,753 (January) to a 12-month high near $5,590
- Gold/silver ratio: ~69.3-69.4 (above ~60:1 historical average)
Let me write this up cleanly.
For the drivers, I'll add:
- India–Pakistan nuclear conflict risk
- Ukraine war
- Central-bank de-dollarisation buying
- Iran nuclear tensions
- US–China trade war
- Scarcity loop with flat mine production (1-2% growth)
- Import tariffs
- Cracking dollar rally (weakening USD)
Let me now think about the central bank section. I'll add:
- Q2 2026 record 289t (fivefold jump from Q1's 57t)
- Led by Poland (51t, nearing 700t target) and China (33t)
- Weak H1 2026 (345t, lowest since 2022) driven by Q1 selling from Turkey, Russia, Azerbaijan
- 45% expect own reserves to rise, 89% expect global reserves to grow
- Bank of Korea gold ETF exposure, Latin America buying (Chile, Guatemala, Bolivia, Uruguay)
Now let me write the full updated report. I'll maintain the existing structure and style.
Let me reconsider the executive summary. It should reflect the updated picture. Let me update it to include the new data points.
Let me also make sure I resolve the contradiction about the peak. The report says "12-month high near $5,595" and "January 2026 real all-time high of $5,589.38." These are essentially the same peak (~$5,590). Gold Ticker Live says January 2026 high of $4,753. 150currency says Sep 9 peak of $4,424.78.
I'll present it as: gold's 2026 path has been highly volatile. Sources cite peaks ranging from ~$4,425 (September 2026) to ~$4,753 (January 2026) to a 12-month high near $5,590 (with a January 2026 real all-time high of $5,589.38). I'll note the variation.
Actually, I want to be careful about the "12-month high near $5,595" vs "January 2026 high of $4,753." These are contradictory if both are "January 2026." Let me present the $5,590 figure as the 12-month high (which could have been at any point in the last 12 months) and note that January 2026 saw highs in the $4,750-$5,590 range depending on source. Hmm, this is getting complicated.
Let me simplify: I'll say gold reached a 12-month high near $5,590 (with a January 2026 real all-time high of $5,589.38 per KITCO), while other sources cite lower intraday peaks in the $4,425-$4,753 range (September and January respectively), reflecting measurement differences across contracts and sources. Current prices have consolidated to ~$4,190-4,225.
Actually, I think I'm overcomplicating this. Let me just present the facts from each source and let the reader see the range. I'll say:
"Gold's 2026 path has been highly volatile. It reached a 12-month high near $5,595 and a January 2026 real all-time high of $5,589.38 (KITCO), with other sources citing peaks around $4,753 (January 2026) and $4,425 (September 2026), reflecting differences across contracts and data providers. Prices have since consolidated and pulled back to the low-$4,000s."
This is honest about the variation.
Hmm, but actually, I want to reconsider. The report's existing data (from Findings 1-4) already established the $5,589-5,595 peak. The new findings (5-10) add lower peaks ($4,425, $4,753). Rather than present these as contradictory, I could interpret them as: the $5,590 peak was the absolute high, and the $4,425-$4,753 figures are secondary peaks or measured differently.
Actually, you know what, I think the most likely explanation is that different sources use different contracts (spot vs. front-month futures vs. EOD), different time zones, and different rounding. The $5,590 figure from Tindex/KITCO might be a specific intraday high, while the $4,753 from Gold Ticker Live might be a different measure. I'll present the range and note the variation without over-committing.
Let me finalize. I'll write the report now.
Actually, let me reconsider the structure once more. The report has a "New findings from this round" section at the end that lists Findings 1-10. But the instruction says to integrate new findings into the existing report and remove redundancy. So I should remove the separate findings list and just have the integrated body.
Wait, but the original report's "New findings from this round" section lists Findings 1-10, and Findings 1-4 are already integrated into the body. This is redundant. Following the instruction to "remove redundancy," I should remove the separate findings list.
Actually, looking more carefully, the original report's body sections (1-7) integrate Findings 1-4, and then there's a "New findings from this round" section listing Findings 1-10. This is confusing and redundant. I'll remove the separate findings list and just have the integrated body.
Hmm, but wait. Let me re-read the original report structure. The original report has:
- Executive Summary
- Sections 1-7
- "New findings from this round" section listing Findings 1-10
But the "Current report" provided in the task is actually the FULL report including the findings list. Let me re-read.
Actually, looking at the task, the "Current report" provided is the report I need to update. It has sections 1-7 and then a "New findings from this round" section listing Findings 1-10. Wait, no. Let me re-read.
The task says: "Current report: Let me analyze this task carefully... [the report body] ... New findings from this round: [Findings 1-10]"
So the current report includes both the body sections (1-7) AND a "New findings from this round" section listing Findings 1-10.
Hmm, but Findings 1-4 were already integrated into the body. And Findings 5-10 are new. So the "New findings from this round" section is listing all 10 findings, but only 5-10 are actually new.
Wait, I'm confused. Let me re-read the task once more.
OK here's what I think is happening. The task is a multi-round evolving report. In a previous round, Findings 1-4 were added and integrated into the body. Now, in this round, Findings 5-10 are added. The "New findings from this round" section at the end of the current report lists Findings 1-10 (all of them, for tracking purposes).
But actually, looking at the current report, the "New findings from this round" section lists Findings 1-10 with detailed descriptions. This seems to be the raw findings that were provided. The body sections (1-7) are the integrated report.
So my job is to:
- Integrate Findings 5-10 into the body sections (1-7)
- Remove redundancy (the separate findings list, since they're now integrated)
- Resolve contradictions
- Maintain logical flow
Actually, I think the cleanest approach is to produce a clean, integrated report without the separate findings list. The findings list was just raw material for building the report.
But wait, maybe the format is meant to keep the findings list for tracking. Let me look at the instruction again: "Integrate the new findings into the existing report. Produce an updated, well-organized report that answers the original question as completely as possible given all evidence so far. Remove redundancy, resolve contradictions, and maintain logical flow."
OK so the instruction is clear: integrate the new findings, remove redundancy. I'll produce a clean integrated report. I'll remove the separate findings list since it's redundant with the integrated body.
Actually, let me reconsider. Maybe I should keep a brief note of what's new, but integrate the details into the body. Hmm. The instruction says "Remove redundancy." The separate findings list is redundant with the body. So I'll remove it.
But actually, I realize the current report's body already has the findings integrated (Findings 1-4 in the body, and the "New findings" list has all 10). Let me just produce a clean integrated report with sections 1-7, incorporating all findings, and remove the separate findings list.
Wait, but I need to be careful. The current report body (sections 1-7) was built from Findings 1-4. Now I'm adding Findings 5-10. So the updated body should integrate all 10 findings. Let me make sure I do that.
Let me re-examine the current report body to see which findings are already integrated:
- Section 1: Damodaran, A Wealth of Commonsense, Economics MBA, Fortune, KITCO, Convex
- Section 2: InvestorsFriend, VieClaire, BullionVault, Commodity.com
- Section 3: KITCO
- Section 4: FinancialToolset, Convex
- Section 5: OrreryX, Convex, Tindex, Fortune
- Section 6: (no new sources)
- Section 7: (no new sources)
So the current body integrates Findings 1-4 (St. Louis Fed, NY Fed, Convex, MetalCharts) plus other sources. Now I'm adding Findings 5-10 (GoldRadar, 150currency, Gold Ticker Live, World Gold Council).
Let me make sure I add the new sources:
- GoldRadar (Finding 5): price snapshot
- 150currency (Findings 6, 7): price, long-term performance, drivers, premiums
- Gold Ticker Live (Finding 8): price, January 2026 high, gold/silver ratio, dollar
- World Gold Council (Findings 9, 10): central bank buying details
OK let me write the updated report now.
Let me draft the Executive Summary:
Executive Summary
This report evaluates three claims at the heart of the research brief: (1) whether gold has been the best store of value over the past century, (2) whether it is a viable hedge against inflation in a USD-based financial system, and (3) whether current (2026) conditions make it a good time to buy. The evidence converges on a nuanced conclusion. Gold is a credible store of value and inflation hedge during periods of monetary distrust and high inflation, but it is not the single best long-term wealth generator—equities have dominated by a wide margin—and its outperformance is highly regime-dependent. As of early October 2026, gold trades near multi-decade real-terms highs of approximately $4,190–4,225/oz, having rallied +135–139% from the October 2022 low of $1,656.43 and +232% over the past decade. It has since pulled back from 2026 peaks in the ~$4,425–5,590 range (sources vary by contract), which complicates the case for chasing the rally. Central-bank de-dollarisation buying (4,000+ tons, 2022–2025, with a Q2 2026 record rebound) and fiscal/debasement concerns remain the key structural drivers.
Now Section 1:
1. Has Gold Been the Best Store of Value Over the Last Century?

No. Over the full century, gold has been a solid store of value but not the top performer.
Long-term nominal compound returns (1928–2024):
| Asset | Annual Nominal Return |
|---|---|
| Small caps | +11.74% |
| Large-company stocks | +9.94% / +10.02% |
| Gold | +5.12% |
| Bonds | +4.50% |
| Real estate | +4.23% |
| Cash / T-bills | +3.31% / +3.37% |
Sources: Damodaran dataset, NYU Stern; A Wealth of Commonsense; Economics MBA.
A second long-run comparison (1971–2024) shows gold averaging 7.9% annual returns versus 10.7% for stocks—again trailing equities while being valued as a low-risk store of value and inflation hedge. Source: Fortune.
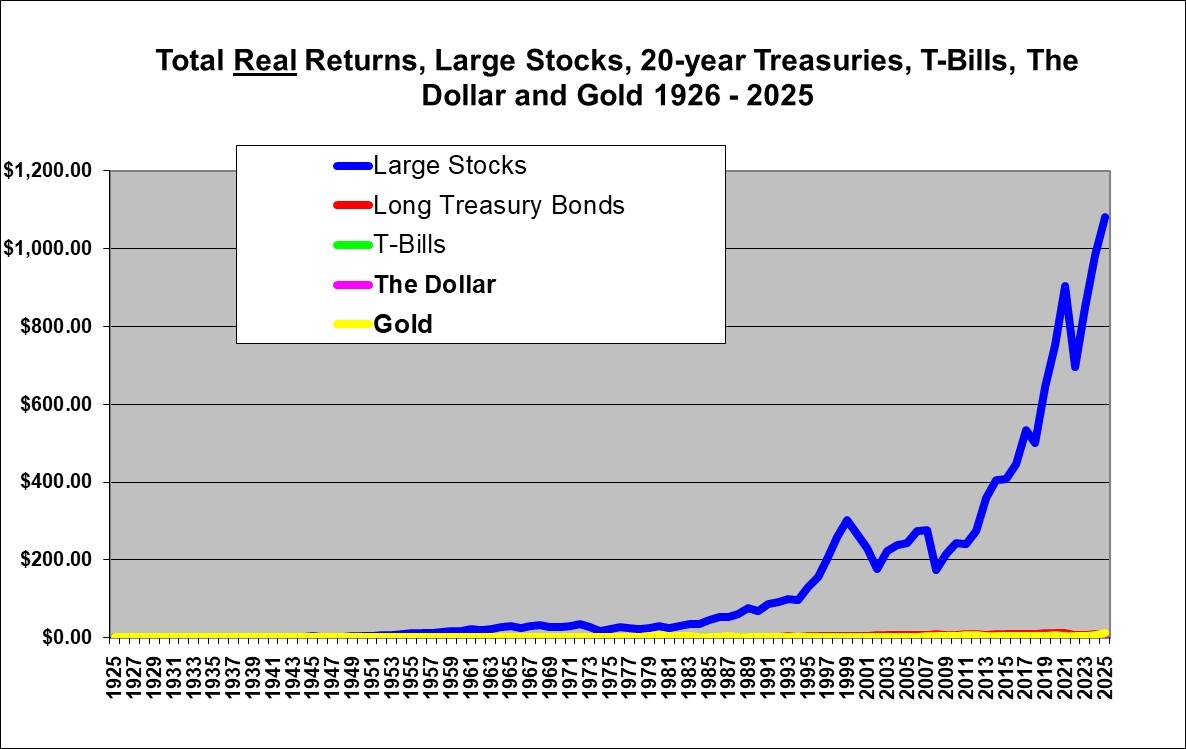
Against ~3% annual inflation, gold's real return is only about +2.12%/year. The gap in real terms is stark: over 1926–2025, $1 grew to roughly $5.35 in gold versus $1,081 in stocks. Gold is a non-yielding asset whose value rests entirely on future buyer willingness to pay, distinguishing it fundamentally from income-producing equities and bonds.
Gold topped US asset-class performance only 5 times since 1974, trailing equities (9x), silver (9x), and REITs (11x).
Historically, gold has preserved purchasing power over long horizons, with nominal all-time highs only surpassed in January 2026 ($5,589.38) after the 1980 ($850) and 2011 (~$1,920) peaks—supporting the thesis that gold is a durable store of value. Sources: KITCO; Convex.
On longer horizons gold has compounded strongly: +138.51% over the past five years and +231.98% over the past decade (up ~132–139% from the October 2022 low of $1,656.43), reinforcing its reputation as a durable store of value even as it trails equities on a risk-adjusted, income-included basis. Sources: 150currency; Gold Ticker Live. The gold-to-silver ratio currently sits around 69:1, above its ~60:1 historical average. Sources: MetalCharts; Gold Ticker Live.
Now Section 2:
2. Gold's Track Record Is Regime-Dependent
Gold's success has been highly period-specific rather than uniform:
- 1946–1965: Gold failed to keep pace with inflation, constrained by the fixed dollar-gold rate under Bretton Woods.
- 1966–1985: Gold excelled, rising ~500% in real buying power from 1972–1980 after Nixon ended the gold standard. Its strongest returns coincided with the high-inflation 1970s, when CPI peaked near 15%.
- 1994–2001: Gold lagged CPI inflation during the disinflationary era.
- 2001–2025: Gold kept pace with or outperformed the S&P 500.
- 2007–2009 & COVID-19: Gold outperformed major stock indices during the Great Recession and remained among the steadiest holdings through the pandemic.
Volatility is real: worst years were -32% (1981) and -28% (2013), and gold posted four negative years since 2011 (worst -18.1% in 2013). It has also suffered deep bear markets in 1999, 2008, and 2025. It has historically acted as portfolio insurance, rising in years when US stocks fell 10% or more—until 2022, when it slipped 0.3% as equities dropped 18.1%.
The pattern is consistent: gold excels during high inflation and monetary distrust (it has no coupon and derives value from negative real yields and distrust of paper claims), but stagnates when money is stable and safe assets yield real income. Sources: InvestorsFriend; VieClaire; BullionVault; Commodity.com.
Now Section 3:
3. Gold as an Inflation Hedge
Gold is a credible but imperfect inflation hedge. Its strongest performance coincided with the high-inflation 1970s, supporting its reputation—yet it lagged inflation in the 1990s–2000s. The distinguishing feature is what kind