

Over the past century, gold has repeatedly proven itself as one of humanity’s most reliable stores of value, particularly during periods of monetary debasement, geopolitical fracture, and prolonged economic instability. While equities and bonds thrive in stable, low-inflation environments, gold’s true edge emerges when those conditions collapse. Despite the Federal Reserve’s consistent messaging that inflation remains manageable, underlying fiscal realities, sovereign debt accumulation, and persistent monetary expansion continue to erode purchasing power in ways that headline CPI numbers fail to capture. Central banks, digital asset competition, and shifting reserve strategies have introduced short-term volatility, yet structural demand remains firmly intact. As of late August 2026, gold is trading near $4,657.58 per ounce, decisively surpassing earlier institutional forecasts and validating its role as a macroeconomic anchor. For investors operating within a USD-denominated financial system, gold should be approached not as a tactical trade dependent on short-term price action, but as a strategic portfolio allocation designed to preserve wealth across decades of monetary experimentation.
A Century in the Making: Gold’s Track Record as a Store of Value
When evaluating whether gold has been the best store of value over the last century, the answer depends heavily on the macroeconomic environment. Gold is neither a productive asset nor a liability; it generates no cash flow, pays no dividends, and carries no credit risk. Yet, across multiple decades of monetary experimentation, it has consistently preserved purchasing power in ways that most traditional financial assets have not. The historical record is not a straight line upward, but it is remarkably resilient during periods when fiat currencies lose their anchor.
The Long Game: Comparing Gold to Equities and Bonds
Empirical data spanning the last hundred years reveals a clear pattern: gold has preserved purchasing power against U.S. equities, particularly during periods of stagflation, geopolitical turmoil, and USD devaluation [5]. Equities have historically thrived in stable, low-inflation environments where corporate earnings grow predictably and discount rates remain favorable. Bonds, meanwhile, perform best when inflation is low and interest rates are declining. Gold, by contrast, shines when those conditions fracture. It functions most effectively as a hedge during stagflation, geopolitical fragmentation, and sustained currency weakness [5]. Long-term comparisons across asset classes confirm that gold’s returns are not driven by cyclical growth but by structural shifts in monetary policy and real interest rates [2, 3]. In environments where central banks prioritize price stability over growth, gold’s historical reliability as a store of value is reinforced rather than diminished.
The 1970s Crucible and Modern Monetary Experiments
The 1970s remain the definitive case study for gold’s monetary role. Following President Nixon’s suspension of the gold standard in 1971, the metal surged from $35 to $800 per ounce throughout the decade, driven by oil shocks, runaway inflation, and a loss of confidence in fiat currency [5]. A similarly pivotal moment occurred in 1933, when the U.S. abandoned the gold standard and gold appreciated by 52% in a single year [5]. These are not isolated anomalies; they are recurring responses to monetary regime changes. When governments prioritize fiscal flexibility over currency discipline, gold tends to outperform as a proxy for currency debasement. This century-long record demonstrates that gold is not merely a speculative asset but a structural hedge against monetary erosion. The disconnect between official inflation narratives and asset price behavior underscores why investors must look beyond headline CPI numbers to gauge true purchasing power preservation.
The Inflation Disconnect: Fed Narratives vs. Purchasing Power Reality
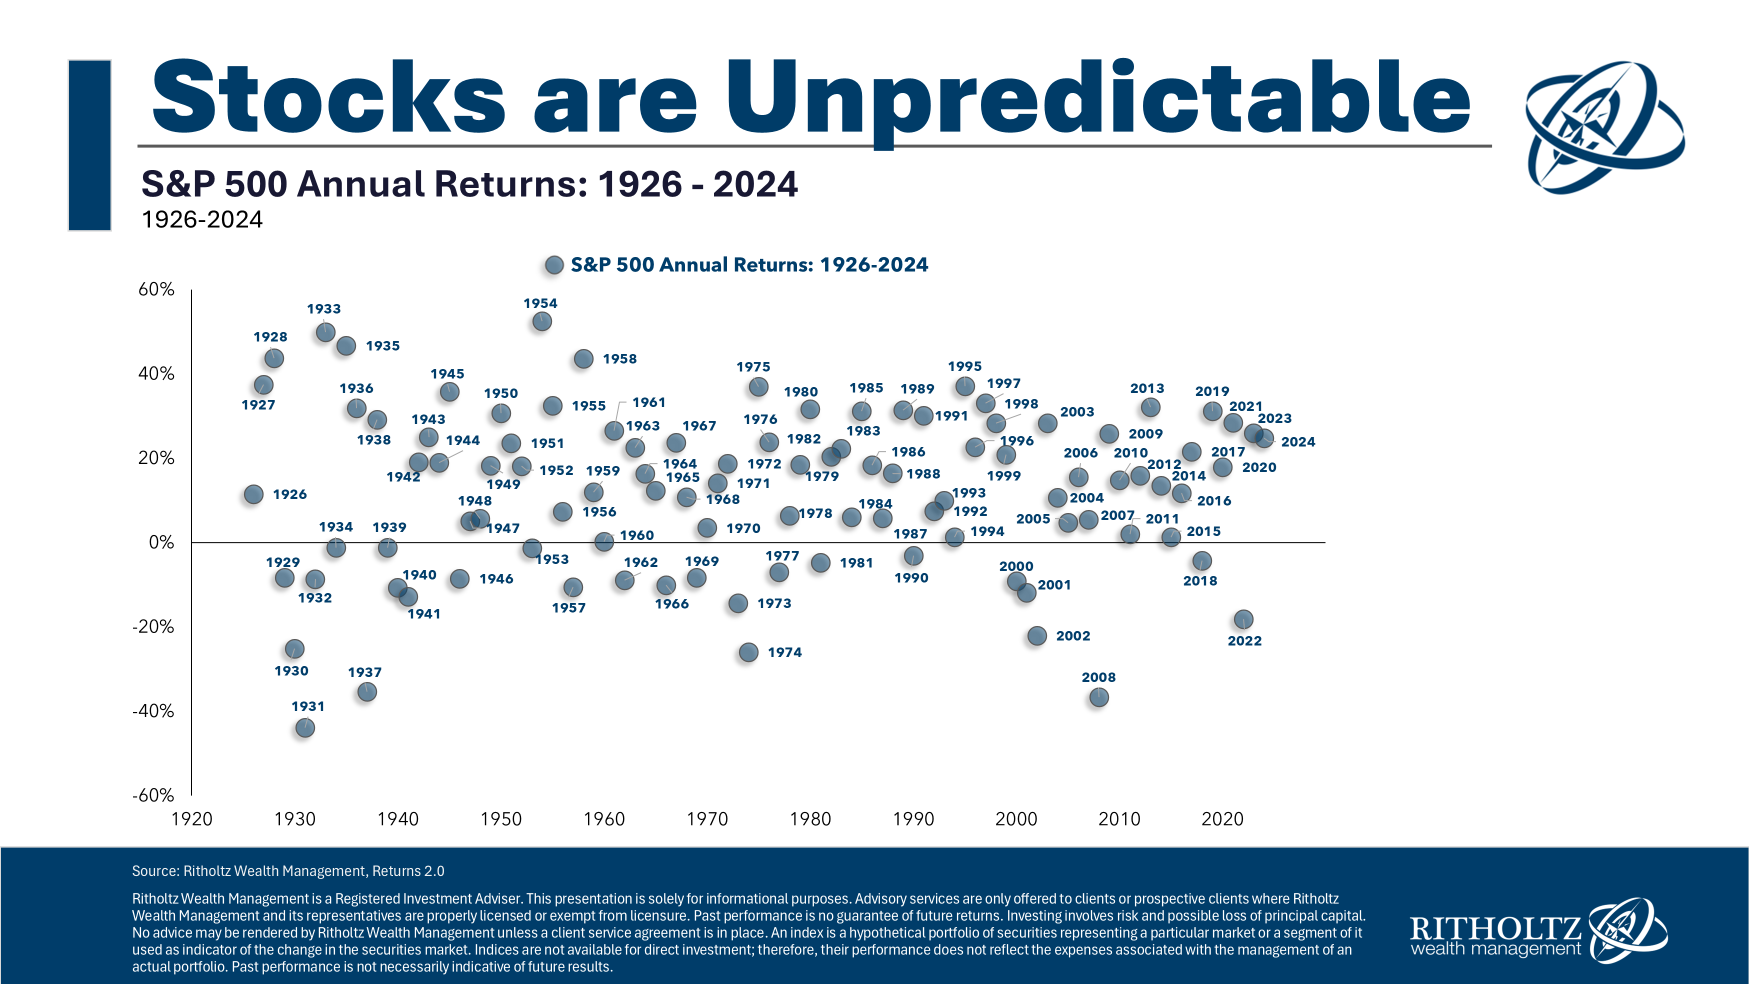
One of the most persistent tensions in modern macroeconomics is the gap between official inflation messaging and the lived reality of purchasing power erosion. The Federal Reserve targets a 2% long-run inflation rate, measured primarily through the Personal Consumption Expenditures (PCE) index, which it favors over CPI for its broader accounting of consumer spending patterns [9]. FOMC projections from September 2025 indicated a policy framework calibrated to gradual normalization, with the Fed adjusting rates based on evolving inflation trajectories [10]. However, the July 2026 Monetary Policy Report and subsequent FOMC communications reveal a more complex reality: inflation remains sticky, and the central bank’s confidence in rapid disinflation has been tempered by persistent price pressures [5, 6].
The PCE Target and the Sticky Inflation Problem
This disconnect is further illuminated by the June 2026 FOMC dot plot, where 9 of 18 officials projected rate hikes in 2026, signaling that the Fed views current inflation as a sustained threat rather than a transitory blip [27]. Market analysts note that while official Fed communications often suggest manageable price pressures, the underlying monetary environment—characterized by expansive fiscal policy, quantitative tightening cycles, and sovereign debt accumulation—continues to erode purchasing power [7, 8]. The relationship between gold and inflation is historically inconsistent. Gold does not move in lockstep with consumer price indices; rather, it responds to monetary expansion, real interest rates, and currency confidence [4]. When the Fed signals that inflation is "transitory" or "not a big deal," markets may initially discount gold. Yet, if underlying monetary conditions remain loose or if fiscal deficits outpace productive capacity, gold tends to outperform as a proxy for currency debasement.
Why Headline CPI Doesn’t Tell the Whole Story
For investors in a USD-based economy, this disconnect is critical. Official inflation metrics often lag behind the erosion of purchasing power caused by expansive fiscal policy and sovereign debt accumulation. Gold’s century-long record demonstrates that it is not merely a speculative asset but a structural hedge against monetary erosion. The disconnect between official inflation narratives and asset price behavior underscores why investors must look beyond headline CPI numbers to gauge true purchasing power preservation. When the Fed targets 2% PCE but fiscal deficits continue to widen and debt-to-GDP ratios climb, the real question becomes whether monetary policy is actually contracting purchasing power, even if consumer price indices appear stable. Gold’s historical reliability during such periods reinforces its role as a barometer for monetary credibility.
Current Market Dynamics: Volatility, Trends, and the Central Bank Shift
Since late 2021, gold has significantly outperformed major equity indices, driven by a confluence of factors: aggressive central bank tightening cycles, shifting geopolitical dynamics, and renewed skepticism toward fiat stability [5]. The metal has exhibited pronounced volatility, swinging sharply in response to rate decisions, employment data, and geopolitical shocks, yet maintaining a clear upward bias over the multi-year horizon. As of late August 2026, gold is trading near $4,657.58 per ounce, reflecting ongoing volatility driven by macroeconomic data, currency shifts, and geopolitical risk [29]. The price action in August alone has been dramatic: opening at $4,043.36 on August 1, the metal surged 4.17% in a single session on August 20, pushing toward the $4,600+ range by month’s end [28, 30]. This trajectory has decisively surpassed earlier institutional forecasts that pegged 2026 targets between $2,400 and $3,200, validating gold’s role as a structural hedge rather than a cyclical trade [6].
Price Action and Structural Drivers
The volatility that accompanies gold’s upward trajectory is not a bug; it is a feature of an asset that responds to real-time shifts in monetary policy, risk sentiment, and sovereign demand. Unlike equities, which can experience prolonged drawdowns during earnings disappointments or rate hikes, gold’s volatility is typically mean-reverting over multi-year horizons. The August 2026 price action, with its sharp single-day surges and rapid retests of support levels, reflects exactly this dynamic. Investors who attempt to time short-term macroeconomic turning points often find themselves whipsawed. Those who treat gold as a strategic allocation, however, benefit from its low correlation to traditional markets and its proven resilience during systemic stress.
The Sovereign Accumulation Trend
A particularly telling development in recent years is the behavior of central banks. Despite record-high prices, sovereign accumulation has remained robust. The World Gold Council reported net central bank purchases of approximately 863 tonnes in 2025, underscoring persistent confidence in gold’s utility as a strategic reserve asset [8]. Monthly breakdowns show continued momentum, with central banks adding 19 tonnes in December alone to reach a year-end total of 328 tonnes in reported net purchases [1]. While reporting methodologies vary—with some analyses citing figures closer to 328 tonnes for specific reporting periods or 1,200 tonnes in gross accumulation metrics—the underlying trend is unambiguous: central banks continue to treat gold as a premier hedge against inflation and USD-denominated financial risks [7, 3]. Surveys indicate that 95% of major central banks expect further reserve increases, signaling that sovereign accumulation will likely continue into 2026 and beyond [2]. In fact, data from early 2026 suggests central banks are buying gold at a record pace, reinforcing the structural shift in global reserve management [3, 4]. This shift in custody patterns reflects a strategic realignment: nations are prioritizing liquidity, diversification, and settlement security over domestic hoarding, reinforcing gold’s role as a critical macroeconomic anchor.
Institutional Outlook & What the Data Actually Says

Major financial institutions maintain a moderately bullish consensus for gold heading into 2026 and beyond, with forecasts ranging between $2,400 and $3,200 per ounce [6]. J.P. Morgan Global Research highlights that this trajectory is underpinned by record central bank purchases, accelerating de-dollarization efforts, and persistent inflation concerns, even as official Fed communications suggest manageable price pressures [3]. However, the actual price action has blown past these targets, forcing analysts to recalibrate their models.
Forecasts, Consensus, and Where Analysts Diverge
Where sources agree, the structural bull case for gold remains intact. Central bank demand, fiscal debt trajectories, and currency diversification continue to support higher price targets, with some institutional models extending bullish projections toward 2030 [10]. Where sources disagree, the debate centers on short-term headwinds. Analysts note that while gold has significantly outperformed equities recently, its near-term trajectory faces resistance from potential real rate increases, strong equity market performance, and competition from digital assets [6]. Some institutional models warn that a return to disinflation and macroeconomic stability could dampen gold’s relative outperformance, while others argue that fiscal imbalances and geopolitical fragmentation will only intensify demand. The gap between pre-2026 forecasts and actual price action highlights gold’s asymmetric upside during periods of systemic uncertainty.
The De-Dollarization and Fiscal Deficit Tailwinds
The de-dollarization trend is perhaps the most underappreciated structural driver. As nations seek to reduce reliance on USD-denominated reserves, gold offers a neutral, liquid, and historically trusted alternative. This is not a speculative narrative; it is a measurable shift in global reserve management. The 95% central bank accumulation survey, combined with the 863-tonne annual purchase figure, reflects a strategic reallocation that will likely persist regardless of short-term price volatility. For investors, this means gold’s demand floor is higher than it has been in decades. The question is no longer whether gold will outperform during periods of monetary stress, but whether it will continue to attract sovereign capital as the global financial architecture evolves.
Strategic Allocation: What to Do, When to Act, and What to Expect
Navigating gold in the current environment requires separating tactical noise from structural signal. The asset’s volatility can tempt short-term traders, but its historical performance suggests that patience and diversification yield superior risk-adjusted returns.
What We Know, What We Don’t, and What to Expect
What We Know: Gold has preserved purchasing power against U.S. equities across multiple decades of monetary experimentation [5]. It functions most effectively as a hedge during stagflation, geopolitical fragmentation, and sustained USD weakness [5]. Central bank demand and custody shifts remain structurally supportive, with 95% of surveyed institutions planning further accumulation [2]. The Fed’s 2% PCE target provides a nominal anchor, but real purchasing power depends on fiscal policy, debt trajectories, and currency confidence [9, 10]. The June 2026 dot plot confirms that nearly half of FOMC members expect rate hikes, validating gold’s role as a hedge against prolonged monetary tightening [27]. Current spot prices near $4,657 reflect a decisive break above prior institutional targets, driven by persistent inflation uncertainty and sovereign reserve diversification [29].
What We Don’t Know: Whether disinflation and macroeconomic stability will return, which would likely dampen gold’s relative outperformance. How future rate cycles will interact with fiscal deficits and debt sustainability concerns. The pace and direction of de-dollarization efforts and their impact on global reserve allocation. Whether digital assets or alternative hedges will erode gold’s dominance in wealth preservation portfolios.
What to Expect: Gold’s trajectory will likely remain volatile but tilted upward as long as the global financial system grapples with persistent inflation uncertainty, major central bank tightening, and shifting geopolitical alliances [5]. If stability and disinflation materialize, equities and bonds may reclaim their historical dominance. If prolonged uncertainty persists, gold’s role as a hard asset hedge will only intensify.
Building a Resilient Position
Regarding timing: gold is best approached not as a tactical trade dependent on short-term price action, but as a strategic allocation. The current environment of elevated volatility offers entry points for long-term holders, but the asset’s true value lies in its low correlation to traditional markets and its proven resilience during systemic stress. Investors should size positions based on portfolio risk tolerance rather than attempting to time macroeconomic turning points. A diversified approach—combining physical gold, gold ETFs, and mining equities—can mitigate volatility while capturing upside exposure. Mining equities, in particular, offer leveraged exposure to gold prices while providing dividend income and operational upside during sustained bull markets.
Conclusion: The Verdict on Gold in a USD-Based Economy
In a financial economy built on the USD, protecting purchasing power requires acknowledging that official inflation metrics do not fully capture monetary erosion. Gold’s century-long record demonstrates that it is not merely a speculative asset but a structural hedge against currency debasement and systemic instability. While volatile in the short term, its long-term performance during periods of economic fracture is unmatched. Central bank accumulation, fiscal reality, and de-dollarization trends have raised gold’s demand floor, while institutional forecasts that initially underestimated these forces have been forced to recalibrate.
For investors seeking to safeguard wealth, gold should be viewed not as a timing-dependent trade but as a portfolio anchor. Its low correlation with traditional assets, institutional demand signals, and historical resilience during USD devaluation make it a prudent allocation in an era where the boundaries of monetary policy remain increasingly uncertain. The question is no longer whether gold has been the best store of value over the last century—it has been one of the most reliable. The question now is whether the next decade will reward those who recognized its structural role in time.
Sources: [1] Central banks buy 19t of gold in December to total 328t in 2025 | KITCO (https://www.kitco.com/news/article/2026-02-04/central-banks-buy-19t-gold-december-total-328t-2025-averaging-27tm-world) [2] US Asset Class Performance & Gold Comparison | BullionVault [3] Stocks, Bonds, Bills and Inflation and Gold [4] Gold vs. Stocks and Bonds: A Historical Comparison of Return | LinkedIn [5] Gold's Performance Against U.S., Asian Equities the Past Century | CME Group [6] Asset Class Comparison Tool | FinancialToolset [7] Central banks buy 19t of gold in December to total 328t in 2025 | KITCO [8] World Gold Council: Global central bank net gold purchases of 863 tons | EEO News (https://www.eeo.news/2026/0129/784336.shtml) [9] The Fed - Inflation (PCE) | Federal Reserve Board [10] September 17, 2025: FOMC Projections materials | Federal Reserve [11] Gold Price Predictions for 2026 and 2027 | J.P. Morgan Global Research [12] Gold Price Prediction 2026: Expert Forecasts & Analysis | MetalsRetirement [13] Gold Price Forecast 2026: Bank Targets & 2030 Outlook | MyInvestAcademy [14] Central Banks | World Gold Council [15] Central Banks Added 1,200 Tonnes in 2025 — What It Means for Gold in 2026 | OnlineGold [16] Central Banks Bought 863 Tonnes Gold 2025 | Mantra Blog [17] Central bank gold statistics: Central banks remain committed to gold | World Gold Council [18] Central Banks Buying Gold — 2025 Rankings and 2026 Outlook | GoldInvest24 [19] Central banks buy 19t of gold in December to total 328t in 2025 | KITCO [20] Central Banks Buying Gold at Record Pace in 2026: Data, Analysis | Middle East Insider (https://themiddleeastinsider.com/2026/04/01/central-banks-buying-gold-2026-record-reserves-analysis/) [21] Central Bank Gold Demand: What It Signals for Gold Prices in 2026 | Natural Resource Stocks (https://naturalresourcestocks.net/central-bank-gold-demand-what-it-signals-for-gold-prices-in-2026/) [22] The Fed - Monetary Policy: Monetary Policy Report (Branch) | Federal Reserve (https://www.federalreserve.gov/monetarypolicy/2026-07-mpr-part3.htm) [23] The Fed - Monetary Policy: Monetary Policy Report (Branch) | Federal Reserve (https://www.federalreserve.gov/monetarypolicy/2026-07-mpr-part1.htm) [24] Federal Reserve policy and inflation 2026: Markets in Focus | Wall Street Economicists (https://wallstreeteconomicists.com/articles/federal-reserve-policy-and-inflation-2026) [25] Federal Reserve policy and inflation trajectory 2026 | Wall Street Economicists (https://wallstreeteconomicists.com/articles/federal-reserve-policy-and-inflation-trajectory-2026) [26] FOMC Summary of Economic Projections for the Personal Consumption Expenditures Price Index | FRED (https://fred.stlouisfed.org/series/PCECTPICTM) [27] The Fed's Dot Plot: 9 of 18 Officials Project Rate Hikes in 2026 | Statistics of the World (https://statisticsoftheworld.com/blog/fed-dot-plot-june-2026-rate-hike-pivot-inflation) [28] Gold Price in August 2026 - Historical Chart and Market Analysis | PriceGold (https://pricegold.net/2026/august/) [29] Gold Price Today | Gold Spot Price Charts - Aug 26, 2026 [30] Gold Price in August 2026 - Historical Chart and Market Analysis | PriceGold (https://pricegold.net/2026/august/)