
Edition Date: 2026-08-23
Topic: Gold, Inflation, USD, and Wealth Preservation
Status: Evolving Research Report
Executive Summary
As of late August 2026, gold has surged to approximately $4,600 per ounce, completing a dramatic V-shaped recovery from a mid-year correction that saw prices plunge more than 25% from a January all-time high of $5,589/oz. This volatility underscores a critical reality: while gold remains humanity's premier store of value over the long term, its path is neither linear nor immune to mechanical headwinds.
Over the last century, gold has delivered an average annual return of +5.12% against inflation averaging ~3%, effectively preserving purchasing power while the U.S. Dollar Index has declined by -0.5% over the last 50 years. However, the 2026 correction reveals that gold's role as an inflation hedge is conditional. When inflation is energy-driven and forces tighter monetary policy, rising real yields can temporarily overwhelm gold's safe-haven appeal.
Current macro data reinforces the structural case for hard assets. Headline CPI remains elevated at 3.4% YoY in July 2026, driven by a 14.7% surge in energy prices, while real wages have declined by 0.2% YoY. Central banks purchased a record 288.9 tonnes in Q2 2026, signaling sovereign confidence in gold as a diversification tool away from the dollar. With U.S. debt exceeding $40 trillion and the Fed pricing only a likely hold with a 42% probability of a September hike, analysts forecast gold targets ranging from $4,790 to $6,000 by late 2026/2027, with UBS targeting $5,000/oz by early 2027.
For investors in a USD-denominated economy, gold is best employed as a strategic diversifier to hedge against fiscal deficits, inflation, and tail risks. The choice of ownership structure—physical allocated gold versus ETF claims—matters significantly for true wealth preservation.
Gold as a Store of Value: The Century in Review
Historical Performance vs. Inflation
To understand gold's current trajectory, we must look through the lens of nearly a century of data. The evidence is robust: gold has consistently preserved purchasing power, though its performance varies by regime and era.
From 1928 to 2024, gold delivered an average annual return of +5.12%, consistently outpacing inflation, which averaged approximately 3% per year over the same 97-year period Source: A Wealth of Common Sense. This long-term outperformance confirms gold's efficacy as a wealth preservation tool against currency debasement.
The comparison becomes even starker when viewed over the last 50 years. Gold's average annual return stands at 7.8%, outperforming U.S. Bonds (5.5%) and significantly beating the U.S. Dollar Index, which has declined by -0.5% over the same period Source: Goldture. This negative return for the dollar highlights the erosion of purchasing power inherent in a fiat system, validating gold's role as a counterweight to sovereign currency risk.
The Equity Gap: Shield vs. Spear
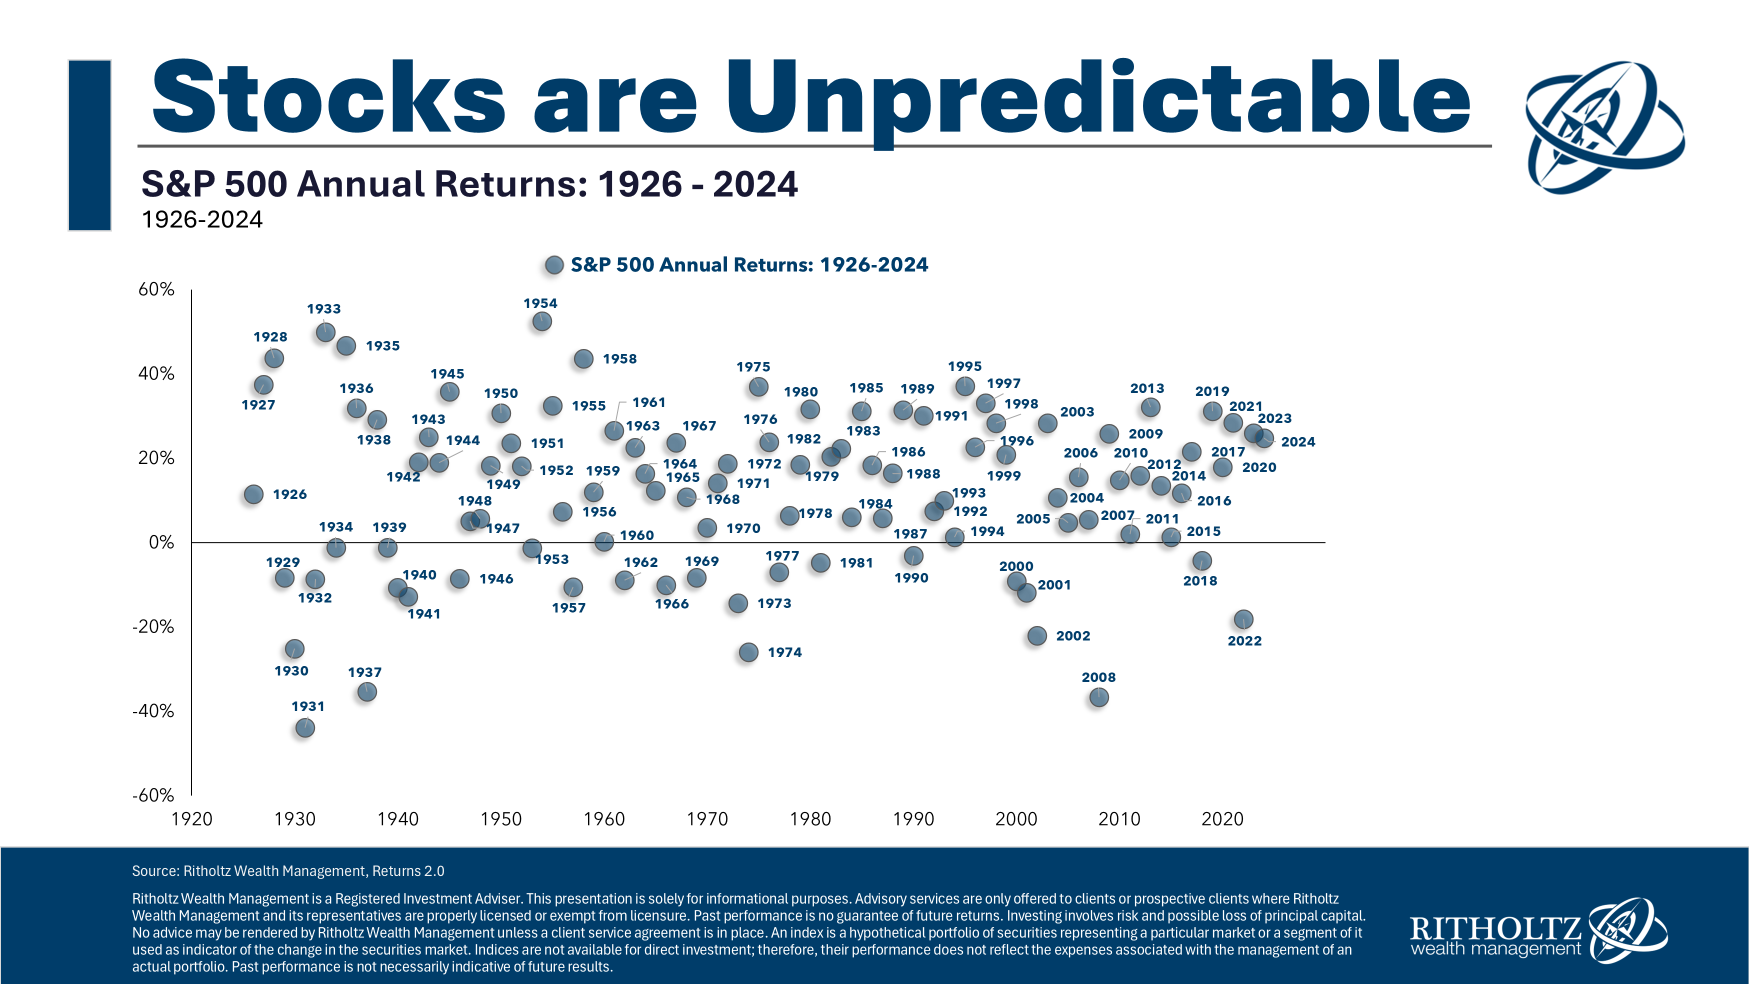
However, a nuanced analysis requires acknowledging where gold trails. While gold protects purchasing power, it trails high-growth assets. The S&P 500 returned 10.7% annually from 1971 to 2024 compared to gold's 7.9%, and U.S. Real Estate returned 6.4% Source: Fortune / Goldture.
This indicates that gold is a shield, not a spear. It preserves wealth against currency debasement but may not offer the highest total returns compared to equities over multi-decade horizons. Investors seeking growth should look to productive assets; investors seeking preservation should look to gold. The optimal strategy involves a diversified portfolio where gold serves as the ballast, reducing volatility and protecting against tail risks that can decimate nominal returns.
The Inflation Reality: Fed Targets vs. Consumer Pain
The CPI Picture
The Federal Reserve targets a 2% long-run inflation rate measured by the PCE index. However, the consumer price landscape tells a more nuanced and often harsher story. According to the U.S. Bureau of Labor Statistics, headline CPI rose 3.4% YoY in July 2026, with core inflation (excluding food and energy) holding at 2.5% Source: BLS / CNBC.
The inflation rise was driven significantly by a 14.7% surge in energy prices, a 3.0% increase in food, and a 3.2% rise in shelter costs Source: RateInflation / CNBC. The CPI index level reached 333.918 in July, with month-over-month inflation turning slightly deflationary at -0.010% Source: RateInflation.
Real Wages and Purchasing Power
Crucially, while PPI remained flat and import/export prices fell, real wages declined by 0.2% YoY over the same period. This divergence between headline inflation metrics and actual household purchasing power highlights the ongoing challenges in maintaining currency stability. The Fed's narrative that inflation is "not a big deal" clashes with the reality of rising energy costs and declining real wages, suggesting that structural erosion of purchasing power persists despite month-to-month fluctuations.
Monetary Policy Uncertainty
Market expectations for monetary policy have shifted. Traders are pricing only a 42% chance for a September rate hike, with analysts suggesting the Fed will likely hold rates steady Source: CNBC / Yahoo Finance. However, this probability is non-trivial, indicating that inflation remains sticky enough to warrant potential tightening. This uncertainty is a double-edged sword for gold: a hold supports gold via lower real yields, while a surprise hike could mechanically pressure prices by boosting the dollar and yields.
Current Market Dynamics: The August 2026 Rally
The $4,600 Rally and Volatility Profile
Gold's recent trajectory has been characterized by extreme volatility and a sustained recovery. Prices climbed from $4,435.85 on August 19 to approximately $4,604 by August 21 Source: CNBC Select / ShowGoldPrice.
- Price Action: After hitting an all-time high of $5,589/oz in January, gold dropped 25%+ to below $4,000 on June 24, 2026. It then staged a sharp rebound, reaching $4,587 by August 21, reflecting a 37% year-over-year increase and a climb of over 25% since early 2025 Source: IG / Fortune.
- Correction Drivers: The mid-year correction was driven by three primary forces:
- Stronger US Dollar: A resurgence in dollar strength pressured gold.
- Higher-for-Longer Rates: Expectations for sustained rate hikes increased real yields, making gold less attractive relative to fixed income.
- Central Bank Demand Concerns: Analysts pointed to potential slowing in central bank buying momentum as a headwind, though Q2 data showed record purchases Source: IG.
The Inflation-Hedge Myth in Specific Regimes
The 2026 correction serves as a vital case study in the mechanics of gold pricing. Gold's inflation-hedge reflex can fail mechanically when inflation is energy-driven and forces tighter monetary policy. In such environments, rising real yields and a stronger dollar can pressure gold prices even as the cost of living rises Source: Golden Ark Reserve / Drawpie.
This was illustrated during the 2026 US-Iran crisis, where gold fell due to rising yields, a stronger dollar, and shifting central bank dynamics, demonstrating that geopolitical turmoil does not guarantee appreciation Source: Ventura Securities. Gold's safe-haven status is conditional; it thrives during currency devaluation and tail-risk events over decades, but can underperform during short-term inflation spikes that trigger rate hikes.
Technical Structure
Despite the volatility, technical analysis confirms a sustained secular uptrend characterized by higher lows and higher highs since 2019, suggesting gold remains structurally sound for preserving purchasing power despite short-term swings Source: FindBullionPrices.
Structural Pillars: Central Banks and Fiscal Dominance
Record Central Bank Demand
Institutional demand remains a structural pillar. Central banks purchased a record 288.9 tonnes in Q2 2026, signaling strong sovereign confidence in gold as a reserve asset and continuing a diversification trend away from the dollar since 2022 Source: GoldSilver.com.
While some analysts noted concerns about "slowing momentum" during the correction, the Q2 data refutes this, showing that sovereign buying is accelerating. This de-dollarization trend provides a floor for gold prices, as central banks accumulate gold for strategic autonomy rather than speculative gain.
The $40 Trillion Debt Overhang
Concurrently, the U.S. national debt exceeding $40 trillion is amplifying gold's safe-haven status. The combination of fiscal deficits, shifting trade price dynamics, and the Treasury's buyback program further erodes domestic purchasing power, validating the structural demand for non-sovereign stores of value like gold Source: ShowGoldPrice / Intellectia.
The Treasury's bond buyback program reduces supply, which can support yields but also signals the government's reliance on monetary-fiscal coordination to manage debt servicing costs. This dynamic reinforces the argument that gold is a hedge against fiscal dominance, where monetary policy may eventually be forced to accommodate fiscal realities.
Strategic Outlook: What to Do, What to Expect

Is It a Good Time to Invest?
At $4,600, gold has recovered significantly from its mid-July lows and is trading near multi-month highs. Historical analysis warns against recency bias—the tendency to extrapolate recent gains into the future. While the macro environment supports gold, chasing price at elevated levels carries risk.
- Allocation Advice: Gold should be viewed as a low-correlation diversifier within a portfolio of stocks, bonds, and real estate, not a standalone solution. Allocation should align with individual risk tolerance and long-term objectives Source: LinkedIn / Jussi Hyvärinen.
- Diversification Rule: No single asset class dominates across all decades. Over-allocating to gold or commodities can introduce unnecessary volatility if other holdings already carry commodity exposure Source: FinancialToolset.
How to Protect Yourself: The Importance of Ownership Structure
Investors seeking to shield purchasing power from inflation can access gold through several vehicles, each with distinct liquidity and management trade-offs. A critical distinction exists between ETFs and physical/vault storage:
- Gold ETFs: These represent a claim on a trust redeemable only by Authorized Participants. While they offer high liquidity and ease of trading, they carry counterparty risk and do not provide direct ownership of the metal. In a tail-risk scenario, liquidity in ETFs can be constrained Source: GoldSilver.com / CNBC Select.
- Physical Bullion/Vault Storage: Offers direct, verifiable, allocated ownership. This provides privacy and eliminates counterparty risk but involves storage challenges, insurance costs, and slower liquidation times compared to securities Source: CNBC Select / GoldSilver.com.
- Gold IRAs: Allow for tax-advantaged accumulation of physical gold, suitable for long-term wealth preservation Source: CNBC Select.
Recommendation: For wealth preservation focused on tail-risk hedging, allocated physical gold or vault storage may offer superior security compared to ETF claims. For tactical positioning, ETFs provide necessary liquidity. The choice of vehicle impacts true wealth preservation; in a crisis of confidence in financial intermediaries, physical ownership is paramount.
What Can We Expect?
- Upside Support: Record central bank purchases, cooling inflation, an inverted yield curve signaling recession fears, a weakening USD, and fiscal concerns provide a structural floor. Analyst targets now range from $4,790 to $6,000 by late 2026/2027, with UBS forecasting a return to $5,000/oz by early 2027 as real rates continue to ease Source: ShowGoldPrice / Fool / UBS.
- Volatility Remains: Gold is marked by high volatility and extended stagnation periods. The 25% drawdown from January to June demonstrates that sharp corrections are inherent to the asset. Investors should expect swings and be prepared for potential pullbacks after rapid rallies Source: LinkedIn / Jussi Hyvärinen.
- Profit-Taking Risks: The rapid rally introduces profit-taking risks, with direction dependent on Treasury policy, Fed responses to inflation data, and evolving geopolitical dynamics Source: ShowGoldPrice.
- Inverse Rate Sensitivity: Unlike bonds or equities, gold generates no cash flow. Its price action is heavily influenced by real interest rates; if inflation re-accelerates and the Fed resumes hiking, gold could face headwinds. However, current data suggests rate pressures are easing Source: LinkedIn / Jussi Hyvärinen.
Knowns vs. Unknowns
| Knowns | Unknowns |
|---|---|
| Gold has preserved purchasing power over the last century (+5.12% avg vs. ~3% inflation) Source: A Wealth of Common Sense. | The Fed's precise path forward; despite soft data, geopolitical shocks or sticky services inflation could force policy surprises. |
| Central banks bought a record 288.9 tonnes in Q2 2026, providing structural demand Source: GoldSilver.com. | Whether central bank demand will sustain at current paces or if the "slowing momentum" cited by some analysts will materialize in Q3/Q4. |
| Gold's price is inversely tied to real interest rates; an inverted yield curve and recession fears currently support gold Source: GoldSilver / Yahoo Finance. | The mechanics of energy-driven inflation: if energy prices remain volatile, the Fed may be forced to hike, which could mechanically pressure gold despite high CPI. |
| Gold outperforms in high-inflation regimes but underperforms equities over the long term Source: Goldture. | Whether $4,600–$6,000 represents a new equilibrium or a cyclical peak; gold has had decades of stagnation historically. |
| UBS forecasts $5,000/oz by early 2027; broader analyst targets range up to $6,000 based on current macro trends Source: Fool / ShowGoldPrice / UBS. | Future USD trajectory; a sudden resurgence in dollar strength or fiscal stabilization could pressure gold prices. |
| No single asset class wins every decade; diversification is essential Source: FinancialToolset. | Geopolitical risks and potential shifts in global reserve currency dynamics or central bank selling. |
| July 2026 CPI stands at 3.4% YoY (core 2.5%), with real wages declining 0.2% YoY, confirming persistent purchasing power erosion Source: BLS / RateInflation. | Inflation expectations may shift if supply chains stabilize or if demand weakens significantly. |
| Treasury debt exceeds $40 trillion and bond buybacks are reducing supply, amplifying gold's safe-haven appeal Source: ShowGoldPrice / Intellectia. | The pace and effectiveness of Treasury buybacks in supporting yields and influencing gold's relative attractiveness. |
| Market pricing suggests a likely Fed hold, but a 42% probability of a September hike remains Source: CNBC. | The impact of energy price volatility (up 14.7% YoY) on future inflation trajectories and consumer sentiment. |
| ETFs carry counterparty risk; physical gold provides allocated ownership. The choice of vehicle impacts true wealth preservation Source: GoldSilver.com. | The long-term impact of falling import/export prices on domestic manufacturing and potential policy responses. |
| Gold's safe-haven status is conditional; it can fall during crises if yields rise or the dollar strengthens Source: Ventura Securities. | The duration of the current de-dollarization trend among sovereign wealth funds. |
Conclusion

Gold's century-long track record validates its role as a premier store of value against currency depreciation and inflation, particularly during periods of monetary instability. The current rally to $4,600 is underpinned by tangible fundamentals: record central bank buying, cooling inflation, an inverted yield curve signaling recession fears, a weakening USD, fiscal concerns with debt exceeding $40 trillion, and the Treasury's bond buyback program. Analyst targets ranging from $4,790 to $6,000 reflect continued macro support, with UBS forecasting $5,000/oz by early 2027.
However, the path forward is not without risk. Gold's volatility, lack of yield, inverse sensitivity to real interest rates, and history of stagnation periods demand discipline. The 2026 correction serves as a reminder that gold's inflation-hedge reflex can fail mechanically when energy-driven inflation forces tighter monetary policy, and that its safe-haven status is conditional on the broader macro regime.
For investors in a USD-denominated economy, gold is best employed as a strategic diversifier to hedge against tail risks, fiscal deficits, and inflation, rather than a speculative bet on continuous upside. The choice of ownership structure—physical allocated gold versus ETF claims—also matters, with physical offering superior security in tail-risk scenarios. As the Fed navigates the delicate balance between price stability and employment, and as real wages continue to lag behind the cost of living, gold remains a critical component of a resilient, long-term wealth preservation strategy.
Sources:
- Asset Class Comparison Tool | FinancialToolset
- Historical Returns For Stocks, Bonds, Cash, Real Estate and Gold
- Gold Performance vs Stocks Bonds Real Estate | 50 Year Investment
- Gold vs. Stocks and Bonds: A Historical Comparison of Return
- Gold vs Stocks & Bonds: What the Data Really Suggests
- The Fed - Inflation (PCE) - Federal Reserve Board
- December 10, 2025: FOMC Projections materials
- Gold Price Rally August 2026: Why Gold Hit $4,400 on Cooling CPI Data
- Gold Price Rally August 2026: Why Precious Metals Are Surging
- Gold Price Outlook August 2026 - GoldSilver
- Gold Price Prediction for August 2026: Bear Market or Cycle Low?
- Gold Is Up Sharply in August. What's Driving It Higher?
- CPI Home : U.S. Bureau of Labor Statistics
- Latest Numbers - U.S. Bureau of Labor Statistics
- USA Inflation Rate | Inflation Rate and Consumer Price Index
- United States Inflation Rate - 2026
- Gold Spot Price Today | Live Chart, Calculator & Price History
- Current price of gold: August 21, 2026 | Fortune
- Gold Price Today | Live Gold & Silver Prices with AI Daily Analysis
- The Price of Gold Today, August 19, 2026 - CNBC
- Consumer prices up 3.4 over the year in July 2026
- US CPI July 2026: Inflation Slows as Gas Prices Fall
- CPI inflation report July 2026: Prices rose 0.1% , annual rate 3.4% - CNBC
- Gold Price Today - Aug 21, 2026: Latest Market Updates
- Is gold still worth buying after falling 25% from its January peak?
- Why Is the Gold Price Falling? 2026 Correction Drivers
- [Why Gold Fell During the 2026 US-Iran Crisis: Key Reasons](https://www.venturasecurities.com/blog/gold-prices-fell-despite-the-2026-us-iran-conflict-learn-how-rising-yields-a-stronger-dollar-s