
Executive Summary
As of August 22, 2026, gold is trading at approximately $4,603.29 per ounce, marking a historic milestone that reflects a profound shift in the global monetary landscape. The metal has surged over 120% since early 2024 and more than 36% in the trailing year, outpacing almost every other major asset class. This extraordinary performance is not merely a speculative frenzy; it is underpinned by structural forces including record-breaking sovereign demand, persistent inflation stickiness that challenges Federal Reserve messaging, and a accelerating de-dollarization of global reserves.
In Q2 2026, central banks purchased a record 289 tonnes of gold—a 62% year-over-year surge—driven by aggressive accumulation from Poland and China. Concurrently, U.S. Core PCE inflation has remained stubbornly persistent at 3.3–3.4% from March through June, and July CPI data showed headline inflation at 3.304% with core at 2.467%, well above the Fed's 2% target. Despite the Federal Reserve holding rates steady at 3.5%-3.75%, with three members dissenting in favor of a hike, the market continues to price in currency debasement risks fueled by massive Treasury debt buyback operations and an inverted yield curve.
Gold's role as the "best" store of value over the last century is nuanced. While it delivered an average annual return of ~5.12% from 1928–2024 against ~3% inflation, its dominance is episodic, thriving during periods of monetary distrust and negative real rates while trailing equities during stable, disinflationary booms. For investors in a USD-denominated economy, the evidence suggests gold functions as an essential hedge against tail risks and currency erosion, supported by a structural floor provided by sovereign buying. Current drivers point to continued upside, with institutional targets ranging from $4,900 to $6,000 by year-end 2026, though the asset's volatility demands a disciplined, regime-aware allocation strategy rather than a directional bet.
A Century of Data: Consistent Store of Value or Episodic Hedge?
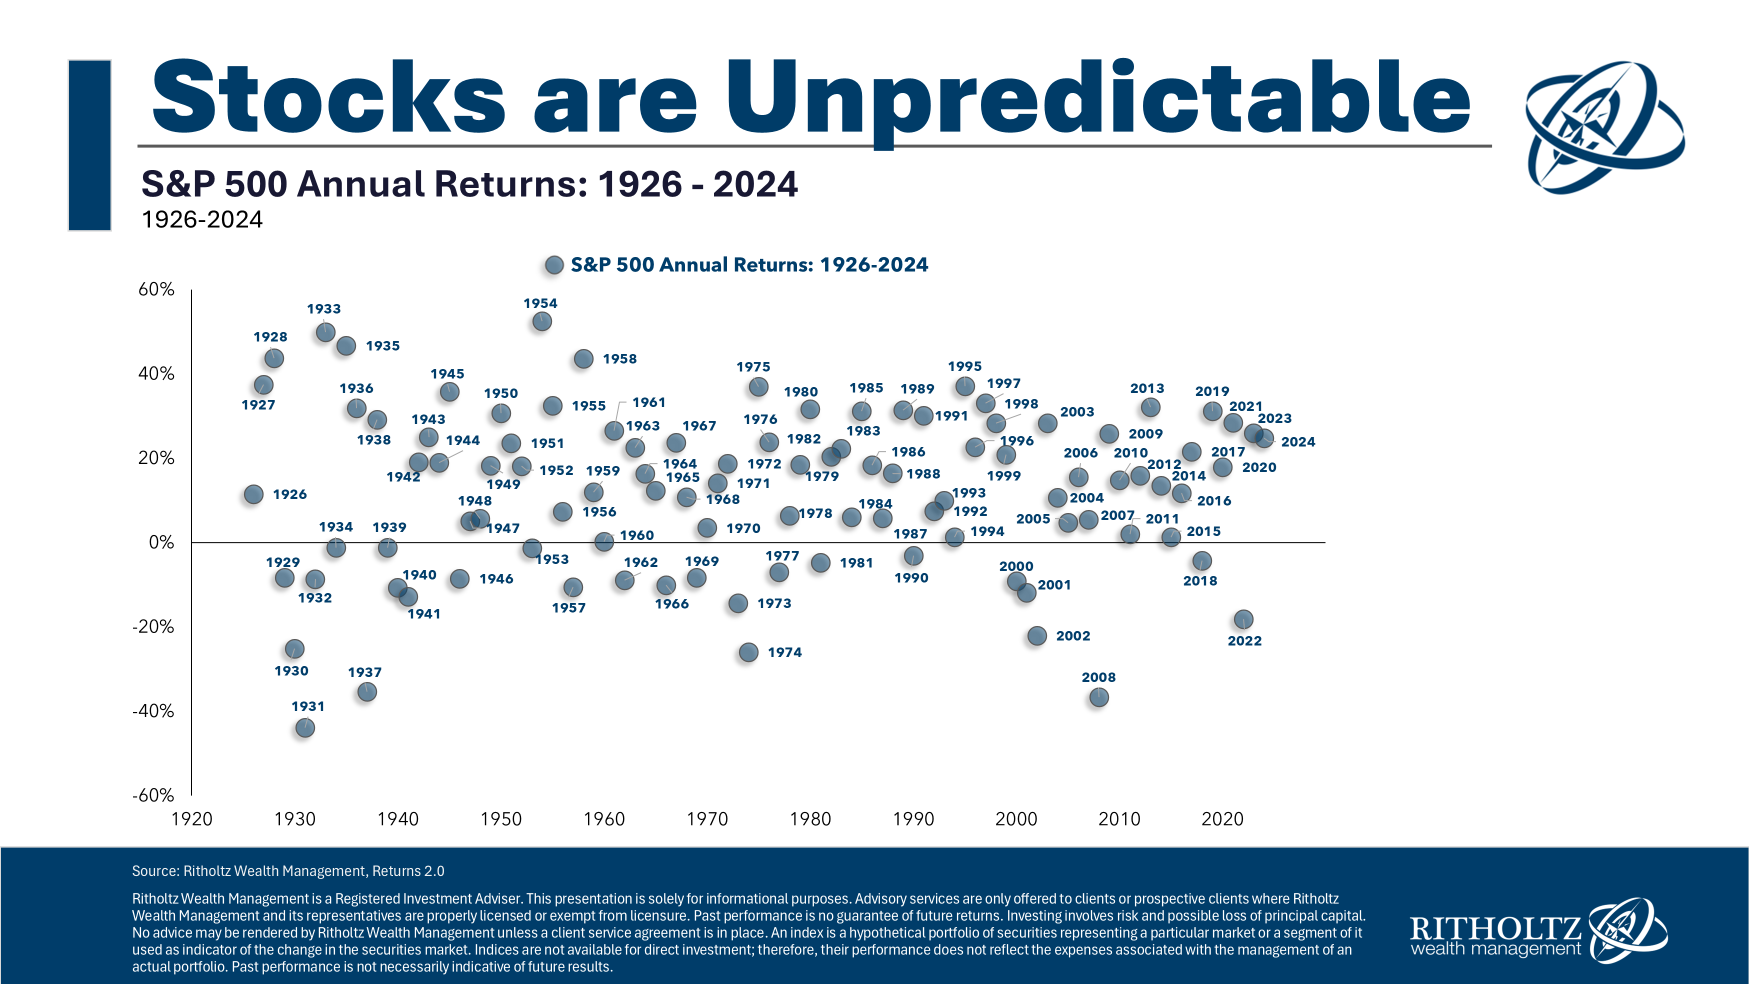
The assertion that gold has been the "best" store of value over the last century requires precise qualification. Historical data reveals distinct performance regimes depending on the monetary framework and economic environment. Gold does not win in every cycle; rather, it cycles in and out of favor based on the prevailing macroeconomic conditions.
Long-Term Performance and Regime Cycles
From 1928 to 2024, gold delivered an average annual return of approximately 5.12%, consistently outperforming the long-term average inflation rate of 3% [https://awealthofcommonsense.com/2025/01/historical-returns-for-stocks-bonds-cash-real-estate-and-gold/]. However, this average masks extreme cyclical variation. Over any given century, no single asset class maintains dominance; performance cycles through periods of leadership among equities, real estate, bonds, and gold [https://goldture.com/tools/gold-vs-other-assets-comparison/][https://commodity.com/blog/gold-compared/].
The data indicates that gold generates no yield and relies entirely on capital appreciation driven by monetary distrust. It excels at protecting purchasing power during severe, persistent inflation but underperforms during disinflationary booms when real yields are positive. The evidence indicates gold is an episodic hedge that thrives during periods of high inflation, negative real interest rates, and declining confidence in monetary policy, rather than a consistently dominant asset class [https://vieclaire.com/en/blog/equities-bonds-and-gold-a-century-of-performance-compared/].
The Fiat Era and Post-1971 Dynamics
Since the decoupling from the gold standard in 1971, gold's performance has been more volatile. From 1971 to 2024, gold delivered an average annual return of 7.9%, trailing equities' 10.7% but serving as a proven store of value during economic instability [https://fortune.com/article/current-price-of-gold-08-21-2026/]. This period includes the stagflation of the 1970s, where gold thrived, and the disinflationary bull markets of the 1980s–2000s, where it underperformed risk assets.
The 2026 performance context continues this pattern of elevated valuation during uncertainty. The average gold price in 2026 has been $4,573.08 per ounce, reflecting a sustained elevated valuation consistent with its historical role as a store of value during inflationary periods [https://www.exchange-rates.org/precious-metals/gold-price/united-states/2026]. This performance underscores gold's effectiveness as a hedge against USD depreciation and macroeconomic uncertainty, with gains of over 36% in the past year alone [https://www.usatoday.com/story/money/personalfinance/2026/08/19/gold-price-on-august-19-2026/91367002007/].
Conclusion on Long-Term Value
While gold has preserved wealth over the long term, its utility is best understood through a regime-aware lens. Investors seeking a "perpetual wealth machine" may find equities superior over stable decades, but those facing monetary expansion, fiscal dominance, and geopolitical fragmentation will find gold's risk-adjusted returns superior during those specific regimes. The current market environment mirrors the conditions where gold historically leads: a loss of faith in fiat policy and a search for neutral reserve assets.
The Inflation Debate: Fed Messaging vs. Structural Reality
A critical tension defines the current gold thesis: the Federal Reserve characterizes inflation as contained, while market pricing and underlying data suggest persistent structural pressures. In a financial economy built on the USD, headline inflation metrics do not fully capture the erosion of purchasing power, and gold's surge implies significant investor concern regarding fiscal deficits, debt monetization, and currency debasement.
Recent Inflation Data and Fed Stance
The Federal Reserve relies heavily on the Personal Consumption Expenditures (PCE) index and underlying measures to calibrate policy. However, recent data challenges the narrative that inflation is fully tamed. Core PCE inflation remained persistent at 3.3–3.4% from March through June 2026, indicating that underlying price pressures have not been fully resolved [https://www.bea.gov/data/personal-consumption-expenditures-price-index-excluding-food-and-energy]. By July 2026, CPI year-over-year changes fluctuated between 2.4% and 4.2% over the past year, with July CPI at 3.304% and Core CPI trending down to 2.467% [https://fredaccount.stlouisfed.org/public/dashboard/13847].
The softening in Core CPI suggests some cooling, but headline inflation remains well above the Fed's 2% target. The St. Louis Fed data confirms that CPI and PCE trends are very similar, reinforcing the view that inflation remains elevated across multiple metrics [https://fredaccount.stlouisfed.org/public/dashboard/13847]. The Fed responded by holding rates steady at 3.5%-3.75%, with three members dissenting in favor of a rate hike. Chair Warsh noted the temporary inflation dip did not influence the decision, underscoring the Fed's focus on persistent underlying price pressures despite short-term energy price volatility from geopolitical events [https://finance.yahoo.com/economy/articles/june-2026-pce-consumer-spending-124715931.html].
Debt Buyback Dynamics and Dollar Weakness
A critical development influencing the USD-gold dynamic is the impact of major debt buyback announcements. A sharp decline in the U.S. dollar and Treasury yields, partly following these announcements, has provided a significant tailwind for gold [https://livegoldprice.net/en/gold-price]. This suggests that market participants are reacting to fiscal operations that may weaken the currency's structural position, even as the Fed downplays inflation.
The U.S. Treasury's active management of the long-end of the yield curve has further accelerated this dynamic. Starting September 9, 2026, the Treasury doubled the size of its liquidity support buyback operations for 10-year to 30-year nominal securities to at least $4 billion per operation, aiming to provide greater liquidity support based on strong market participation [https://home.treasury.gov/news/press-releases/sb0607]. Analysts note that while these buybacks ease long-term yields, they simultaneously introduce structural risks to USD stability [https://www.cnbc.com/2026/08/20/treasury-bond-buybacks-long-term-yields.html]. The resulting dollar weakness and compressed yield curve directly benefit gold, reinforcing the thesis that fiscal operations designed to stabilize debt markets can inadvertently accelerate the very currency debasement gold is meant to hedge against [https://basispoint.net/economy-insights/treasury-bond-buyback-dollar-weakness-gold-rally-bessent-2026].
The Divergence
Sources generally agree that inflation remains a structural concern despite Fed rhetoric. The Atlanta Fed's Underlying Inflation Dashboard and the Cleveland Fed's Inflation Nowcasting model highlight persistent trends [https://www.atlantafed.org/research-and-data/data/underlying-inflation-dashboard][https://www.clevelandfed.org/indicators-and-data/inflation-nowcasting]. However, the divergence lies in interpretation: the Fed emphasizes the rate of change and temporary factors, while gold markets price in the cumulative effect of fiscal dominance and reserve diversification. Gold's historical correlation with periods of monetary expansion and declining institutional trust makes it a structural counterweight to USD-centric inflation, even when official channels suggest the threat is minimal.
Current Market Dynamics: Volatility, Upside Bias, and Regime Shifts

Gold has exhibited notable volatility while leaning sharply toward the upside in recent cycles. As of August 22, 2026, gold is trading at $4,603.29 per ounce [https://pricegold.net/today/ounce/].
Price Action and Volatility
The metal's price trajectory illustrates rapid fluctuations interspersed with consolidation. On August 19, 2026, gold was reported at $4,495.44 per ounce, representing a 34.69% gain over the past year and a 12.52% gain over the last month [https://www.usatoday.com/story/money/personalfinance/2026/08/19/gold-price-on-august-19-2026/91367002007/]. By August 22, the price had advanced to $4,603.29, indicating a sharp recovery and continued upward momentum over a three-day period. This movement highlights the asset's responsiveness to shifting macroeconomic signals.
Despite the broader uptrend, short-term consolidation is evident. As of August 22, 24-hour performance data shows complete price stability with zero change, indicating a brief consolidation phase following the recent surge [https://pricegold.net/today/ounce/]. The weekly breakdown reveals a pattern of sharp gains interspersed with consolidation, including a 7.39% surge in early August and a 5.65% jump in the final recorded week. Daily price action confirms active trading conditions with frequent double-digit percentage swings, indicating that while gold remains a highly liquid and responsive asset, its short-term trajectory is subject to rapid fluctuations rather than steady appreciation [https://mygoldcalc.com/gold-price/2026/08].
Key Structural Drivers
Current price action is supported by a confluence of structural and cyclical factors:
- Record Central Bank Buying: Q2 2026 saw a record 289 tonnes of net central bank gold purchases, a 62% year-over-year surge, driven primarily by Poland and China [https://www.tftc.io/central-bank-gold-purchases-record-289-tonnes-q2-2026][https://www.gold.org/goldhub/research/gold-demand-trends/gold-demand-trends-q2-2026/central-banks]. Central banks have averaged 1,000 tonnes annually over the past four years—double the previous decade's pace—providing a durable price floor [https://www.analyticsinsight.net/banking/how-central-bank-gold-buying-is-supporting-the-gold-price-rally].
- De-Dollarization Expectations: 74% of surveyed central banks expect the U.S. dollar's share of reserves to decline, and 89% anticipate continued gold accumulation, with a record 45% planning to increase their own holdings [https://www.gold.org/goldhub/research/gold-demand-trends/gold-demand-trends-q2-2026/central-banks][https://www.analyticsinsight.net/banking/how-central-bank-gold-buying-is-supporting-the-gold-price-rally]. This structural shift away from USD-centric portfolios reinforces gold's role as a sovereign hedge.
- USD and Yield Decline: A sharp decline in the U.S. dollar and Treasury yields, partly following major debt buyback announcements, has provided a tailwind for gold [https://livegoldprice.net/en/gold-price].
- Labor Market Weakness: Gold has responded sharply to deteriorating labor data, with a recent 7% weekly rally following weak U.S. jobs reports, highlighting the asset's sensitivity to recession risks [https://www.analyticsinsight.net/banking/how-central-bank-gold-buying-is-supporting-the-gold-price-rally].
- Institutional Outlook: Institutional forecasts remain bullish, with targets ranging from $4,900 to $6,000 by year-end 2026, while technical analysis suggests gold will remain firm near key moving averages as long as dollar weakness persists [https://livegoldprice.net/en/gold-price].
Regime Awareness
Despite the upward bias, investors must guard against recency bias. Recent price action cannot be reliably extrapolated into future returns, as gold's performance is tightly coupled to shifting macroeconomic regimes [https://financialtoolset.com/tools/investment/asset-class-comparison/]. The asset's utility is best understood through a regime-aware lens: it tends to outperform when real yields turn negative or when confidence in fiat policy wavers, and it lags when monetary policy is credible, rates are stable, and risk appetite is high.
Knowns vs. Unknowns
What We Know
- Gold's structural dependence on real interest rates and confidence/trust metrics is well-documented [https://vieclaire.com/en/blog/equities-bonds-and-gold-a-century-of-performance-compared/].
- It functions optimally as a diversifier against inflation and systemic risk, not as a standalone long-term wealth compounder [https://vieclaire.com/en/blog/equities-bonds-and-gold-a-century-of-performance-compared/].
- No single asset class consistently outperforms; cycling dominance makes tactical timing notoriously difficult [https://financialtoolset.com/tools/investment/asset-class-comparison/].
- Long-term historical averages (~5.12% annualized return vs. ~3% inflation) provide a baseline but obscure extreme cyclical variation [https://awealthofcommonsense.com/2025/01/historical-returns-for-stocks-bonds-cash-real-estate-and-gold/].
- The average gold price in 2026 has been $4,573.08 per ounce, reflecting sustained elevated valuations [https://www.exchange-rates.org/precious-metals/gold-price/united-states/2026].
- Current volatility and upside bias reflect historical drivers: monetary distrust, inflation fears, and structural USD debasement risks that persist regardless of Fed messaging [https://vieclaire.com/en/blog/equities-bonds-and-gold-a-century-of-performance-compared/].
- Gold's recent surge is supported by central bank buying, inverted yield curve signals, USD weakness driven by debt buyback announcements, and institutional targets suggesting further upside [https://livegoldprice.net/en/gold-price][https://goldsilver.com/industry-news/article/gold-price-outlook-august-2026/].
- Price movements are explicitly linked to inflation expectations, U.S. dollar strength, and central bank policies [https://www.usatoday.com/story/money/personalfinance/2026/08/19/gold-price-on-august-19-2026/91367002007/].
- Core PCE inflation remained persistent at 3.3–3.4% from March to June 2026, and July CPI data showed headline at 3.304% with core at 2.467%, confirming inflation remains structurally embedded despite Fed rate holds and reliance on underlying measures [https://www.bea.gov/data/personal-consumption-expenditures-price-index-excluding-food-and-energy][https://fredaccount.stlouisfed.org/public/dashboard/13847].
- Treasury liquidity buybacks (doubling to $4B per operation for 10-30yr securities) are compressing long-term yields and weakening the dollar, directly supporting gold's structural bull case [https://home.treasury.gov/news/press-releases/sb0607][https://www.cnbc.com/2026/08/20/treasury-bond-buybacks-long-term-yields.html].
- Central bank buying reached a record 289 tonnes in Q2 2026 (62% YoY surge), with 74% of surveyed central banks expecting the dollar's share to decline and 89% anticipating continued gold accumulation, establishing a structural floor for gold prices [https://www.tftc.io/central-bank-gold-purchases-record-289-tonnes-q2-2026][https://www.gold.org/goldhub/research/gold-demand-trends/gold-demand-trends-q2-2026/central-banks][https://www.analyticsinsight.net/banking/how-central-bank-gold-buying-is-supporting-the-gold-price-rally].
- Gold has reacted sharply to weak labor data, with a 7% weekly rally following poor U.S. jobs reports, underscoring its role as a recession hedge [https://www.analyticsinsight.net/banking/how-central-bank-gold-buying-is-supporting-the-gold-price-rally].
What Remains Uncertain
- The timing, duration, and severity of the next inflationary or distrust-driven regime that would catalyze a sustained gold bull market.
- Whether the inverted yield curve will trigger a recession that alters gold's risk/return profile, as gold can underperform in severe deflationary crashes despite its safe-haven status.
- How future Fed rate adjustments, quantitative tightening/easing, and fiscal policy trajectories will interact with gold's real-yield sensitivity.
- The long-term impact of digital asset competition, central bank reserve diversification, and evolving geopolitical alliances on gold's demand structure.
- The sustainability of central bank buying trends and the specific mechanics of sovereign debt buyback programs on gold's price discovery.
- Whether the current consolidation phase signals a deeper correction or merely a pause before the next leg up toward institutional targets.
- The extent to which the softening in Core CPI (2.467% in July) may reduce the urgency for gold as an inflation hedge, versus the persistence of headline inflation and structural USD risks.
Strategic Allocation for Wealth Preservation
For investors operating in a USD-based economy, the evidence supports a diversified, regime-aware approach rather than a concentrated bet on gold. The record central bank buying and de-dollarization expectations suggest gold's structural role is elevated, but volatility demands discipline.
Gold as Insurance, Not Speculation
Allocate gold as a strategic portfolio component (typically 5–10% in most institutional models) to hedge against inflation, currency devaluation, and tail risks. Treat it as portfolio insurance rather than a directional trade [https://vieclaire.com/en/blog/equities-bonds-and-gold-a-century-of-performance-compared/]. The record 289 tonnes of Q2 central bank buying provides a structural floor, reducing the risk of a permanent capital loss in a crisis scenario.
Diversification Across Regimes
Combine real assets (gold, real estate), inflation-protected securities (TIPS), and productive assets (equities) to cover different economic environments. No single class wins across all cycles [https://financialtoolset.com/tools/investment/asset-class-comparison/]. Given the 7% weekly rallies and consolidation phases, attempting to time entries is particularly risky. Dollar-cost averaging and periodic rebalancing are more reliable than attempting to predict asset class leadership.
Monitor Real Yields and Confidence Metrics
Gold's price action is most predictive when tracked alongside real interest rates, central bank balance sheets, and sovereign debt trajectories rather than headline inflation alone. The divergence between Fed messaging and market pricing suggests that gold's utility is best assessed through the lens of institutional trust metrics. Investors should focus on regime-aware allocation, maintain discipline against recency bias, and recognize that gold's greatest value lies in what it protects against, not in what it compounds.
Access Vehicles and Consumer Protection
Investors can gain exposure through exchange-traded funds (ETFs), physical holdings, or Gold IRAs, depending on their tax situation and liquidity needs. Research indicates there are reputable platforms available for purchasing gold, with comparisons of pricing and services available to help investors select the best options [https://fortune.com/article/current-price-of-gold-08-21-2026/][https://www.cnbc.com/select/the-price-of-gold-today-august-20-2026/]. In an economy where inflation persists above target and the dollar faces structural headwinds, investors should consider broader protection strategies. This includes maintaining liquidity in hard assets, reviewing fixed-income durations, and ensuring that portfolio allocations reflect the reality of underlying inflation measures rather than relying solely on Fed communications [https://primerates.com/primerate/inflation-tracker/].
Conclusion
Gold is a proven episodic hedge, not a perpetual wealth machine. Its current price near $4,603 per ounce and explosive growth over the past two years reflect historical drivers: monetary distrust, inflation fears, and structural USD debasement risks that persist regardless of Fed messaging. The average price of $4,573.08 in 2026 underscores the metal's sustained role as a store of value during periods of economic uncertainty.
While the central bank may characterize inflation as contained, the long-term erosion of purchasing power in a fiat-based system remains a structural reality. Core PCE persistence at 3.3–3.4% through June 2026 and July CPI data showing headline at 3.304% confirm that underlying price pressures remain embedded. The Fed's reliance on underlying measures like the Atlanta and Cleveland dashboards does not fully capture the currency risk pricing in by gold. Gold belongs in a diversified portfolio as a counterweight to currency risk and systemic fragility, not as a standalone strategy.
The record 289 tonnes of central bank buying in Q2 2026 and the expectation among 74% of surveyed central banks that the dollar's share will decline signal a structural shift in global reserve composition. This de-dollarization trend provides a durable floor for gold prices, reinforcing its role as a hedge for USD-based investors. However, gold's volatility—evidenced by 7% weekly rallies on weak jobs data and subsequent consolidation—demands a disciplined, long-term perspective. Investors should focus on regime-aware allocation, maintain discipline against recency bias, and recognize that gold's greatest value lies in what it protects against, not in what it compounds. The current market environment, characterized by an inverted yield curve, sustained central bank buying, USD weakness driven by debt dynamics, and a recent consolidation phase, suggests gold remains in a powerful structural bull phase, but its volatility demands a diversified, long-term approach.