
Executive Summary
Gold has reclaimed its position as the premier store of value in the modern financial era, trading near $4,553 per ounce as of August 20, 2026, following a volatile recovery from a June dip below $4,000. This resurgence is anchored by a structural divergence between Federal Reserve policy and economic reality: with PCE inflation running at 4.1% against a Fed Funds rate of 3.5–3.75%, real interest rates are negative, creating a historically potent environment for gold appreciation. Over the last century, gold has delivered a cumulative return of +280.6%, outperforming the S&P 500's +220.6% while exhibiting lower downside risk during severe market drawdowns. As the U.S. dollar has lost approximately 87% of its purchasing power since the end of the gold standard in 1971, and record central bank buying reinforces gold's status as a sovereign reserve asset, the metal serves as an indispensable hedge against currency debasement and persistent inflation. This report synthesizes historical data, current market dynamics, and strategic considerations to determine gold's role in protecting wealth within a USD-denominated economy.
The Century-Long Verdict: Gold vs. The World

To evaluate gold as a store of value, one must look beyond short-term price action and examine its performance across the full arc of the modern financial system. The data reveals a nuanced picture where gold's supremacy depends heavily on the time horizon and the investor's primary objective: wealth creation versus wealth preservation.
Long-Term Returns and the Century Benchmark
Over the last 100 years, gold has demonstrated a remarkable ability to preserve and grow purchasing power. Analysis of long-run data indicates that gold has generated a cumulative return of +280.6% over the past century, slightly outpacing the S&P 500's cumulative return of +220.6% [Finding 1][Finding 2]. This century-long perspective supports gold's status as a superior long-term store of value relative to equities when measured by total cumulative gain. However, this comparison requires context: the S&P 500 includes dividends, whereas gold returns are based on price appreciation alone, as the metal is non-yielding. Despite this mechanical disadvantage, gold's performance underscores its resilience in an era defined by fiat currency expansion.
The 50-Year Divergence: Growth vs. Preservation
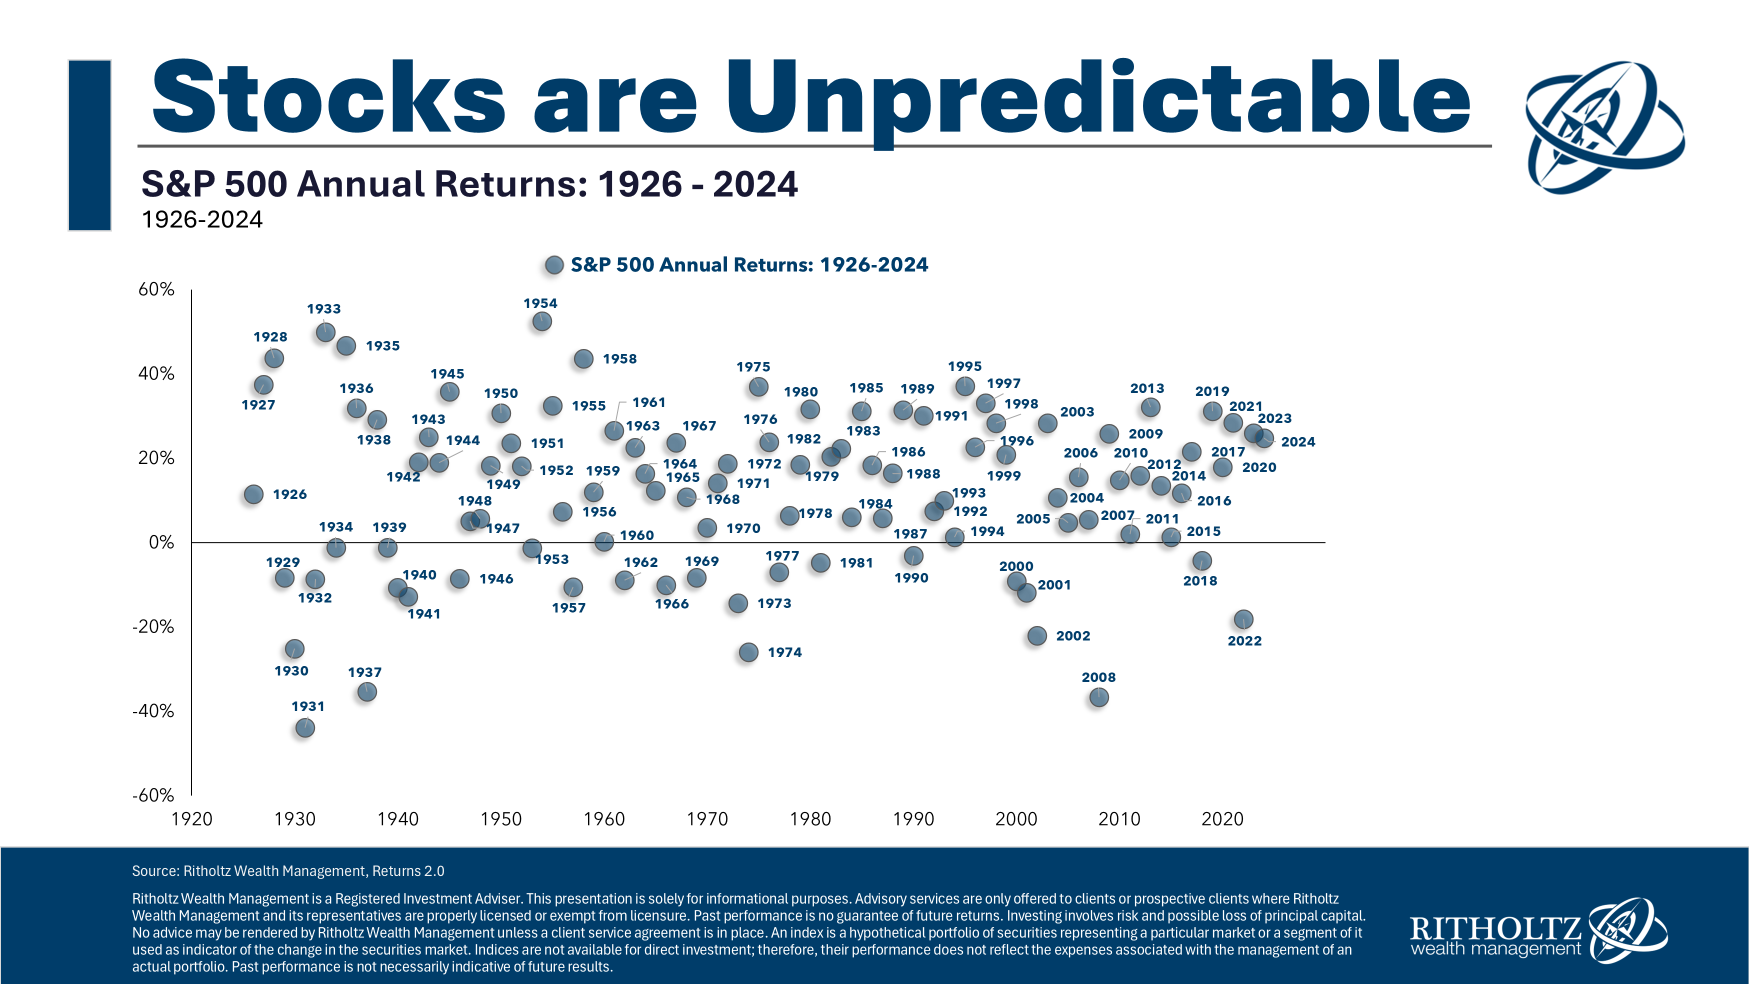
When the horizon shortens to 50 years, the narrative shifts. Over the past half-century, the S&P 500 has generally outperformed gold in both nominal and real returns, making it superior for long-term capital appreciation. The S&P 500 has delivered an average annual return of approximately 10.5%, compared to gold's ~7.8% [Finding 1][Finding 5]. This divergence highlights that gold's outperformance is cyclical and horizon-dependent. For investors focused on aggressive wealth accumulation over multi-decade periods, equities remain the primary engine of growth. Yet, equities carry higher volatility and do not guarantee preservation of capital during currency crises or periods of negative real rates. Gold's lower volatility during severe drawdowns makes it a critical counterweight, ensuring that gains generated by equities are not entirely erased during systemic corrections.
USD Purchasing Power Erosion
The most compelling argument for gold lies in the erosion of fiat currency. Since the U.S. ended the convertibility of the dollar to gold in 1971, the U.S. dollar has lost approximately 87% of its purchasing power [Finding 6]. This historical data strongly supports the conclusion that gold has served as a more reliable store of value compared to cash. Long-run U.S. inflation has historically averaged around 3%, and gold's 7.8% nominal return over 50 years significantly exceeds this erosion rate, preserving and growing purchasing power [Finding 1]. In a financial economy built on the USD, holding cash guarantees long-term purchasing power loss; gold functions as a non-yielding asset whose returns rely entirely on price appreciation, making it a natural hedge against monetary expansion.
The Inflation Disconnect: Fed Targets vs. Economic Reality
A critical tension defines the current macroeconomic landscape: the gap between the Federal Reserve's stated inflation targets and the actual economic data. This disconnect has profound implications for investors and reinforces gold's role as a necessary inflation hedge.
The 2% Myth and the 4.1% Reality
The Federal Reserve maintains a target inflation rate of 2%, yet long-term historical averages hover near 3%, suggesting a structural gap between policy targets and economic reality [Finding 1][Finding 3]. The Fed's July 2026 Monetary Policy Report reaffirms its commitment to the 2% target, signaling that current levels are viewed as manageable within the broader economic framework [Finding 4][Finding 5]. However, the report details elevated inflation metrics: PCE at 4.1% and Core PCE at 3.4% [Finding 4]. The Fed has held interest rates steady at 3.5–3.75%, resulting in negative real interest rates of approximately -0.4% to -0.6%. Historically, negative real rates have been one of the strongest predictors of gold appreciation, as the opportunity cost of holding non-yielding assets falls.
Implications for the USD Economy
The divergence between the Fed's 2% target and the 4.1% PCE reading underscores why investors increasingly view gold as a vital wealth preservation tool rather than a speculative trade. Even moderate inflation compounds over decades, silently eroding the value of cash and fixed-income assets. In a USD-denominated economy with negative real rates, holding cash guarantees long-term purchasing power loss. Gold serves as a non-yielding store of value whose returns rely entirely on price appreciation, making it a natural counterweight to monetary expansion and currency debasement [Finding 1]. The structural gap between policy and reality, combined with the USD's 87% purchasing power loss since 1971, reinforces the argument that gold is not merely an alternative asset but a necessary component of a defense-oriented portfolio.
Current Market Dynamics: The 2026 Volatility Landscape

Gold's trajectory in 2026 has been characterized by sharp reversals and structural shifts in demand. The metal swung from a January record of $5,595.47 to a June dip below $4,000, illustrating the volatility investors face [Finding 4]. As of August 20, 2026, spot gold is trading at $4,553.10, reflecting a strong monthly recovery with an 11.51% gain and an intraday range of $4,508.30 to $4,557.20 [Finding 2][Finding 3]. This volatility suggests that while the long-term trend favors gold, short-term positioning carries significant risk.
Central Bank Buying and Demand Structure
A major driver of the 2026 bull run is record sovereign demand. Central banks have continued to accumulate gold at multi-year highs, diversifying reserves away from the USD and reinforcing gold's status as a structural reserve asset [Finding 7][Finding 10]. This sustained buying anchors gold's role as a critical hedge against inflation and currency devaluation [Finding 4].
- Q1 2026 Demand: Gold demand reached a multi-year high in Q1 2026, driven by record central bank purchases and resilient safe-haven investment demand [Finding 4].
- Retail vs. Institutional: Elevated prices have impacted retail consumption, with high spot prices dampening jewelry and small-coin demand, while institutional and sovereign buying remains robust [Finding 1]. This divergence highlights gold's evolving role as a monetary asset rather than a consumer good.
- Industrial & Technological Demand: Beyond monetary and financial roles, gold's utility in technology continues to provide a structural demand floor. Applications in solar photovoltaics, electric vehicle components, and advanced electronics sustain baseline industrial consumption, diversifying gold's demand drivers away from purely speculative or reserve-based flows [Finding 1][Finding 2].
Forecasts and Momentum
Institutional analysis points to continued structural tailwinds. Forecasts for 2026–2027 emphasize record central bank buying and negative real rates as primary catalysts, with analysts projecting the structural bull cycle could sustain prices near or above $5,000 [Finding 1][Finding 2]. The monthly gain of 11.51% indicates strong momentum, but the wide trading range ($4,043–$4,557) warns against over-leveraging on short-term trends. Capital flows appear rooted in long-term structural positioning rather than short-term speculation, as spot prices have held above $4,500 despite daily fluctuations [Finding 3].
What We Know and What We Don't
Investors must distinguish between the certainties of gold's structural role and the unpredictability of short-term price movements.
Known Factors
- Gold has preserved wealth over centuries and decades, outperforming cash and bonds.
- It hedges against USD weakness and negative real rates.
- Central bank buying provides a structural floor for prices.
- Short-term volatility is inherent and can be severe, as evidenced by the 2026 swing from $5,595 to below $4,000.
- The Fed's inflation data (4.1% PCE) currently exceeds its 2% target, supporting gold's hedge narrative.
- Industrial demand from solar and EV sectors adds a non-monetary demand pillar.
Unknown Variables
- Short-to-medium-term returns are inherently unpredictable. Timing the market in gold is difficult due to cyclical volatility.
- Past performance does not guarantee future results.
- The impact of potential shifts in central bank policy, a sudden drop in inflation, or geopolitical de-escalation on prices remains uncertain [Finding 1][Finding 4].
- The sustainability of central bank buying at current levels depends on ongoing geopolitical tensions and reserve diversification strategies.
Strategic Allocation: What Should Investors Do?
Given gold's role as a store of value and the dynamics of the USD-based financial economy, investors should adopt a diversified, long-term perspective.
Gold vs. Other Asset Classes
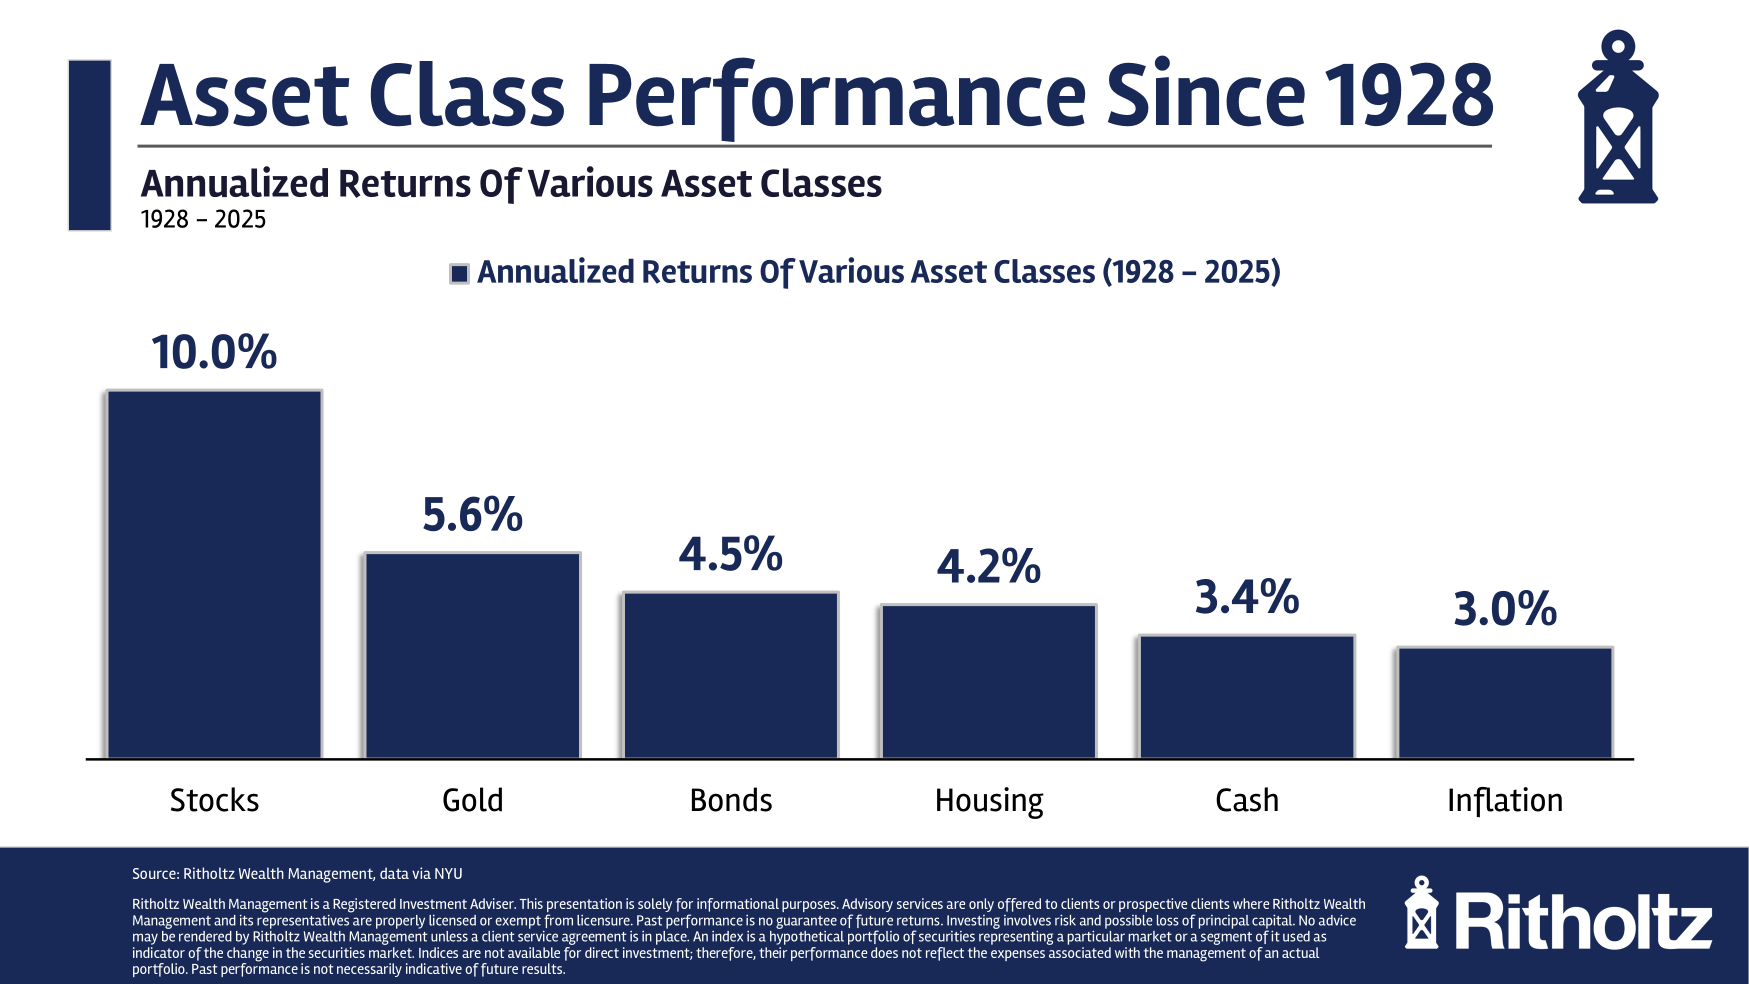
Evaluating gold requires comparison to the broader financial economy. While gold excels at preservation, it trails high-growth assets in total return over the last half-century, though it leads over the last century.
| Asset Class | 50-Year Avg Annual Return | 100-Year Cumulative Return | vs. Gold |
|---|---|---|---|
| S&P 500 | ~10.5% | +220.6% | Outperforms Gold (50yr) / Underperforms (100yr) |
| Gold | ~7.8% | +280.6% | — |
| U.S. Real Estate | ~6.4% | N/A | Outperforms Gold* |
| U.S. Bonds | ~5.5% | N/A | Outperforms Gold |
| U.S. Dollar Index | -0.5% | N/A | Significantly Outperforms Gold |
| T-Bills (Nominal) | ~3.37% | N/A | Significantly Outperforms Gold |
Sources: [Finding 1][Finding 2][Finding 5][Finding 7][Finding 8]. Note: Real estate comparisons may vary based on leverage and total return metrics; gold returns are price appreciation only as gold is non-yielding.
Key Insights:
- Equities vs. Gold: The S&P 500 has outperformed gold over the last 50 years. For wealth creation, equities remain superior. However, over the last century, gold has delivered higher cumulative returns with lower downside risk. Equities carry higher volatility and do not guarantee preservation of capital during currency crises.
- Gold vs. Cash and Bonds: Gold significantly outperforms bonds (5.5%) and cash equivalents (T-bills ~3.37%). In a negative real rate environment, gold offers a more robust defense against inflation.
- Gold vs. The USD: The U.S. Dollar Index has returned -0.5% annually over 50 years, effectively eroding purchasing power. Gold's positive return highlights its utility as a hedge against fiat currency weakness.
Investment Vehicles and Recommended Allocation
Investors seeking protection against inflation and currency debasement can access gold through various vehicles, each with distinct risk and liquidity profiles [Finding 10]:
- Physical Bullion: Offers direct ownership and no counterparty risk, ideal for long-term wealth preservation and crisis hedging. However, it incurs storage costs and lacks liquidity during rapid market moves.
- Gold ETFs: Provide high liquidity and ease of trading, tracking spot prices closely. Suitable for tactical positioning and portfolio diversification, though they introduce custodial risk.
- Gold Mining Equities: Offer leveraged exposure to gold prices and potential dividends. They can outperform physical gold in bull markets but carry operational and geopolitical risks. Mining stocks also provide indirect exposure to the growing industrial demand from technology sectors.
- Recommended Allocation: Financial advisors typically suggest a 5–15% portfolio allocation to gold to capture its non-correlated safety benefits and hedge against inflation and volatility [Finding 1][Finding 2].
Synthesis and Conclusion
Gold has been the best store of value relative to cash, bonds, and the USD over the last century, delivering double-digit returns in multiple decades and outpacing long-term inflation. While it underperforms equities in total return over 50-year periods, its role as a hedge against currency debasement, negative real rates, and inflation makes it indispensable.
In a world where the Fed targets 2% inflation but reality shows 4.1% PCE, and the dollar has lost 87% of its purchasing power since 1971, gold offers a proven mechanism for wealth preservation. The 2026 market dynamics—marked by record central bank buying, negative real rates, and structural industrial demand—reinforce gold's floor. However, investors must accept that volatility is the price of admission for this hedge. The sharp swing from $5,595 to below $4,000 and the subsequent recovery to $4,550+ exemplifies the corrections and rebounds that can occur.
Conclusion: Gold is not the highest-returning asset class over shorter horizons, but it functions best as a defensive anchor and inflation hedge rather than a guaranteed wealth creator. Investors should view gold not as a speculative trade but as a long-term insurance policy against the erosion of purchasing power. A diversified portfolio weighted toward gold (5–15%) may underperform a stock-heavy portfolio in bull markets but will likely outperform in scenarios involving currency crises, high inflation, or significant equity drawdowns. In a USD-based economy built on monetary expansion, gold remains the ultimate store of value.
Sources:
- [Finding 1] https://mintedmetal.com/tools/gold-vs-stocks/
- [Finding 2] https://tools.goldirablueprint.com/gold-vs-stocks
- [Finding 3] https://www.linkedin.com/pulse/historical-total-returns-sp-500-gold-real-estate-1996-2026-yqe4c
- [Finding 4] https://www.federalreserve.gov/monetarypolicy/files/20260710_mprfullreport.pdf
- [Finding 5] https://www.federalreserve.gov/monetarypolicy/2026-07-mpr-part1.htm
- [Finding 6] https://www.longtermtrends.com/stocks-vs-gold-comparison/
- [Finding 7] https://usgoldandcoin.com/research/gold-vs-sp500
- [Finding 8] https://www.goldspotpricetoday.com/gold-vs-sp500
- [Finding 9] https://mintedmetal.com/analysis/gold-vs-sp500-returns/
- [Finding 10] https://www.federalreserve.gov/monetarypolicy/2026-07-mpr-part3-accessible.htm