

Gold has repeatedly demonstrated its utility as a premier store of value over the past century, particularly when measured against the erosion of fiat purchasing power rather than nominal price appreciation. While broad equities have delivered superior long-term wealth creation, gold consistently outperforms during periods of high inflation, negative real interest rates, and macroeconomic stress. The current macroeconomic landscape, as of August 2026, reveals a growing divergence between the Federal Reserve's measured messaging and on-the-ground economic reality. Sticky core inflation, FOMC policy paralysis, and a weakening labor market have created a classic "policy trap" that historically favors hard assets. Record-breaking central bank accumulation, persistent fiscal deficits, and geopolitical fragmentation have further reinforced gold's structural appeal. For investors operating within a USD-denominated financial system, strategic allocation to gold—typically 5–15% of a diversified portfolio—serves as critical portfolio insurance against inflation mispricing and currency debasement. While gold's inherent volatility demands disciplined entry strategies and regime-aware positioning, the combination of monetary accommodation, cumulative purchasing power erosion, and institutional demand creates a robust case for gold as the ultimate defense of wealth in the current era.
Introduction
For over five millennia, gold has served as humanity's monetary anchor, transcending empires, wars, and financial revolutions. In the modern era, however, its role has been fiercely debated. Proponents point to its inability to be printed, its chemical inertness, and its century-long track record of preserving purchasing power during monetary crises. Skeptics highlight its lack of yield, its volatile price action, and the superior long-term returns of productive assets like equities. The question is no longer whether gold can store value, but rather how it should be positioned within a financial system built on the U.S. dollar, where official inflation metrics often fail to capture the full extent of currency debasement.
As of August 2026, the macroeconomic environment has rendered this debate urgently relevant. The Federal Reserve finds itself caught between fighting persistent price pressures and supporting a fragile labor market, while global central banks accelerate reserve diversification away from dollar-denominated assets. Understanding gold's historical mechanics, the current inflation disconnect, and the structural drivers of price action is essential for investors navigating an era of monetary expansion and geopolitical fragmentation. This report synthesizes historical performance data, current market dynamics, institutional forecasts, and strategic allocation frameworks to answer a fundamental question: in a USD-based financial economy, is gold the right answer for protecting wealth, and what does the evidence suggest about the path ahead?
A Century of Performance: Gold vs. Equities and Bonds
The Long-Run Wealth Creation Narrative
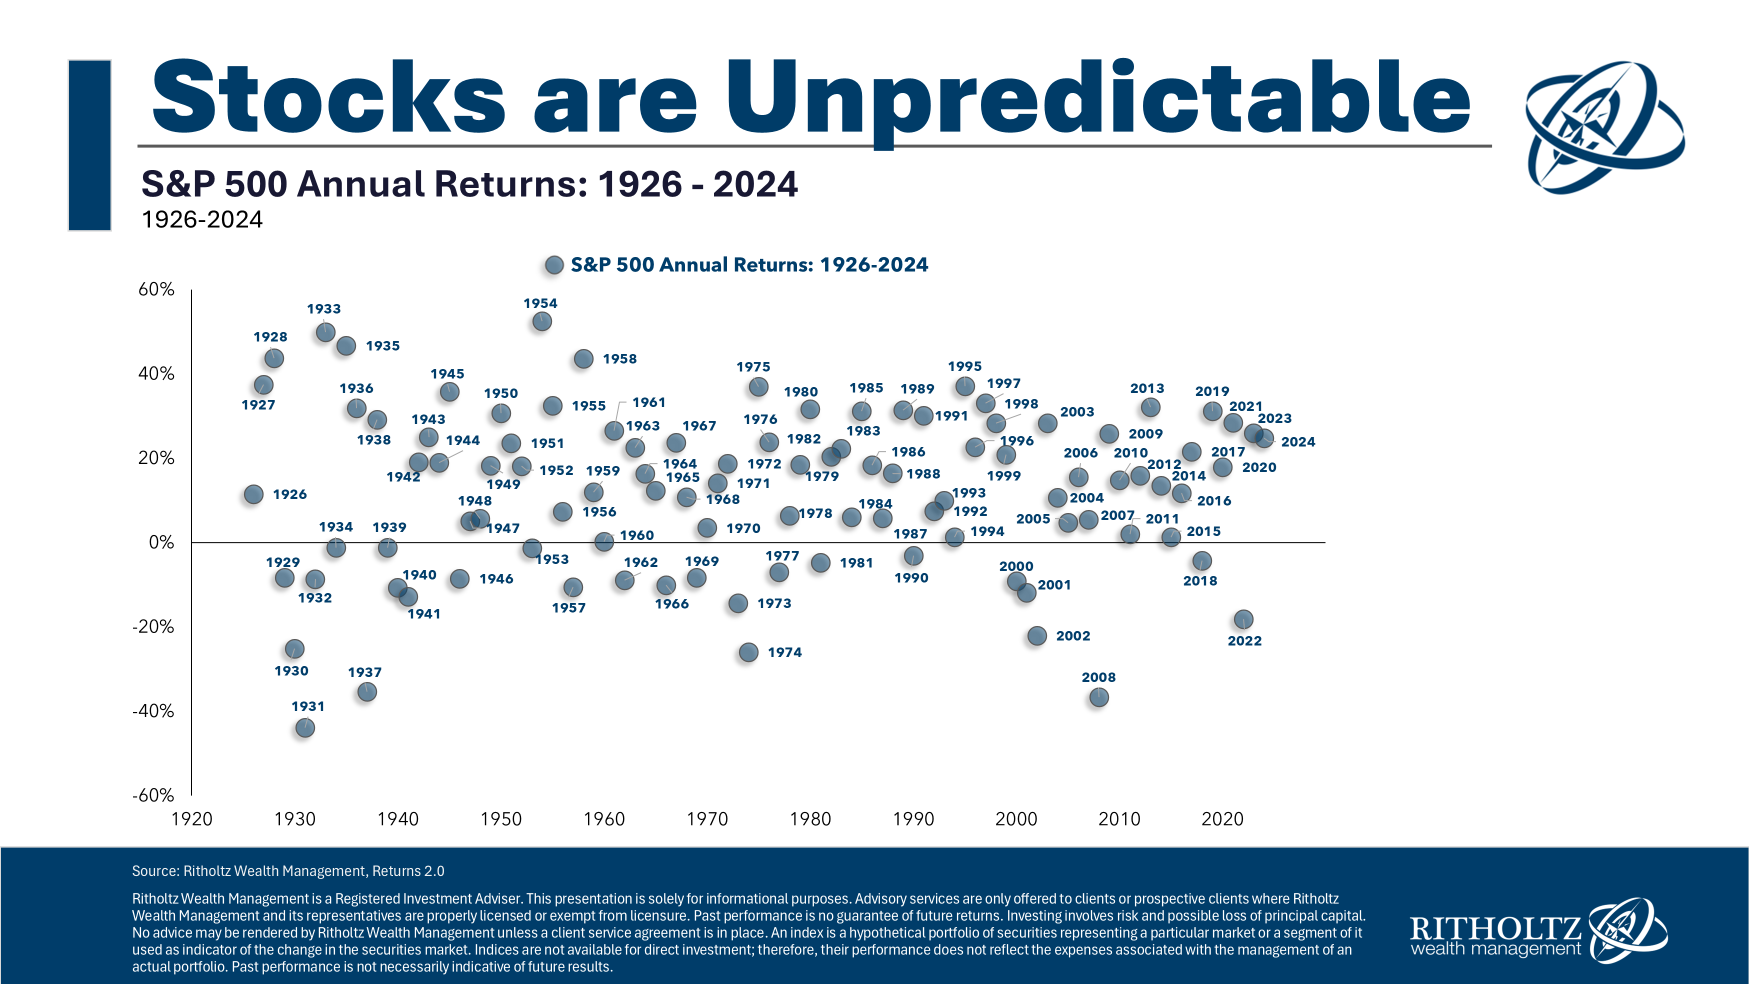
When evaluating gold's century-long track record, it is crucial to separate nominal price appreciation from real purchasing power preservation. Over the past 100 years, broad equity indices, particularly the S&P 500, have dominated long-term wealth creation, delivering compound annual returns that consistently outpace gold on a total-return basis. However, this dominance is not uniform across all market regimes. Rolling 10-year analyses reveal that equities suffer prolonged drawdowns and negative real returns during periods of high inflation, declining real interest rates, and macroeconomic uncertainty [westmountfundamentals.com/gold-vs-stocks-historical]. Over the full century, gold has acted less as a growth engine and more as a structural hedge against fiat currency depreciation [vieclaire.com/en/blog/equities-bonds-and-gold-a-century-of-performance-compared/].
This distinction matters profoundly for portfolio construction. Investors who measure gold's success solely against stock market rallies will inevitably view it as a lagging asset. Yet those who measure it against the erosion of the dollar's purchasing power recognize its true utility. During the high-inflation 1970s and the post-2008 monetary easing cycle, gold delivered substantial real returns while bonds suffered from negative real yields and equities experienced prolonged periods of stagnation [linkedin.com/pulse/gold-vs-stocks-bonds-historical-comparison-returns-jussi-hyvarinen-tbsbf]. The asset's century-long performance confirms its role as a store of value, though its volatility and lack of yield make it unsuitable as a sole portfolio component.
Regime-Dependent Outperformance
Gold's historical outperformance is heavily regime-dependent. In low-inflation, high-growth environments, productive assets like equities and real estate naturally dominate. But when central banks expand balance sheets aggressively, when real interest rates turn negative, or when geopolitical shocks disrupt supply chains, gold's non-sovereign, non-yielding nature becomes its greatest strength. Historical data from the 1970s and 1980s, when sustained double-digit inflation (7–13%) decimated fixed-income portfolios, shows gold appreciating by over 1,000% in nominal terms while the S&P 500 remained largely flat in real terms [inflationtool.com/rates/usa]. Similarly, the post-2008 era of quantitative easing and near-zero rates saw gold surge from approximately $500 to over $1,900 by 2011, precisely when traditional safe havens like Treasury bonds offered negative real yields.
The evidence suggests that gold's century-long track record validates its utility as a monetary anchor, but only when evaluated through the lens of currency debasement rather than speculative price action. Investors who treat gold as a tactical hedge rather than a growth asset align their expectations with historical reality.
The Inflation Disconnect: Fed Messaging vs. Economic Reality

The Fed's Policy Trap
The Federal Reserve maintains a 2% inflation target, but the August 2026 macroeconomic landscape reveals a growing divergence between official messaging and market reality. The central bank faces a classic policy dilemma: sticky inflation persists alongside a weakening labor market and geopolitical supply shocks, limiting its ability to act decisively. Recent analysis of the FOMC's August inflation forecast highlights significant internal friction. Committee members have expressed dissent regarding the trajectory of prices, acknowledging that Core PCE remains sticky and that trailing-12-month (TTM) inflation has peaked but remains elevated [fool.com/investing/2026/08/06/fed-august-inflation-forecast-arrived-wall-street/; fool.com/investing/2026/08/09/federal-reserve-just-released-august-inflation/].
This environment contradicts the narrative that inflation is "not a big deal." Instead, the data suggests a stagflationary risk: the Fed cannot hike rates aggressively without breaking the labor market, yet cutting rates risks re-igniting price pressures. This policy paralysis is historically bullish for gold, as it implies real interest rates will remain suppressed and monetary accommodation will persist. Weak employment, CPI, and PPI data have reduced the probability of a September rate hike from 50% to 31%, reinforcing expectations for monetary easing [goldsilver.com/industry-news/article/gold-vs-stocks-bonds-what-the-data-really-suggests/]. Negative labor reports historically boost gold through anticipated Fed pivots and declining real yields.
Cumulative Inflation and the Purchasing Power Erosion
Broader price indices underscore the erosion of purchasing power that headline metrics often understate. The PCE Price Index stood at 131.392 in June 2026 (base year 2017=100), reflecting cumulative inflation that significantly outpaces wage growth [fred.stlouisfed.org/series/PCEPI/]. While the July 2026 CPI report showed a 3.4% year-over-year increase in all items with core inflation at 2.5%, the August trailing 12-month rate settled at 3.36% with an annualized figure of 2.79% [cnbc.com/2026/08/12/cpi-inflation-report-july-2026.html; in2013dollars.com/current-inflation-rate/current-inflation-rate].
Historical context reveals persistent volatility: the 1970s and 1980s experienced sustained double-digit inflation, and the 2021 spike reached 7.04% before moderating [inflationtool.com/rates/usa]. Over the past five years, the rolling average has hovered near 4.18%, significantly above the Fed's target [inflationtool.com/rates/usa]. Cumulative inflation since 2019 has outpaced wage growth, leaving households with diminished real income [keepingupwithinflation.com/inflation-statistics/]. In a financial system built on the USD, persistent money supply expansion and fiscal deficits erode purchasing power in ways that headline inflation metrics often understate. This cumulative debasement is precisely why gold's role as a store of value has regained prominence among institutional and retail investors alike.
Current Market Dynamics: August 2026 and Beyond
Price Action and Volatility
Gold's recent trajectory underscores its role as a macro barometer. The metal has demonstrated exceptional strength in August 2026, rising approximately 10–11.20% month-over-month, with spot prices settling near $4,495–$4,496 per troy ounce as of August 19–20, 2026 [kitco.com/charts/livegold.html; usatoday.com/story/money/personalfinance/2026/08/19/gold-price-on-august-19-2026/91367002007/; mygoldcalc.com/gold-price/2026/08]. This marks a 34.69% increase over the past year, though prices remain roughly 17.93% below the 52-week high of $5,477.79, highlighting the asset's inherent volatility [usatoday.com/story/money/personalfinance/2026/08/19/gold-price-on-august-19-2026/91367002007/].
The current rally follows a notable Q1 2026 correction, which tested investor conviction before the metal resumed its upward path. Unlike speculative surges driven by leverage or momentum, the current price action is underpinned by structural demand and reserve diversification, making the uptrend more resilient to typical market corrections [goldsilver.com/industry-news/video/gold-vs-stocks-vs-real-estate-what-the-data-shows/]. The 17.93% gap below the 52-week high indicates that corrections remain possible, but the directional bias favors buyers as long as monetary policy remains accommodative and inflation expectations stay anchored above target.
Structural Drivers: Central Banks, Geopolitics, and De-Dollarization
Several structural factors are underpinning gold's volatility and directional bias. First, global central banks purchased a record 289 tonnes of gold in Q2 2026, a 62% jump from the previous quarter, signaling sustained institutional demand for reserve diversification [tftc.io/central-bank-gold-purchases-record-289-tonnes-q2-2026; metalscost.com/news/central-bank-gold-buying-q2-2026-record-289-tonnes; catenaa.com/markets/global-markets/central-bank-gold-buying-q2-2026/]. This acceleration reflects a strategic de-dollarization trend and a response to geopolitical fragmentation and fiscal imbalances driving gold's appeal.
Second, geopolitical tensions affecting oil prices and broader commodity markets have reinforced the case for "commodity exposures" as a hedge against supply shocks and inflation [intellectia.ai/blog/august-cpi-report-fed-decision-2026]. Gold, as the premier hard asset, benefits directly from this rotation. Third, persistent U.S. fiscal deficits and geopolitical fragmentation continue to drive structural demand for non-sovereign stores of value. Analysts identify central bank accumulation, Fed policy expectations, de-dollarization trends, fiscal imbalances, and USD strength/weakness cycles as the five primary macro drivers of current price action [aurumrates.com/gold-price-forecast-2026].
Institutional Forecasts and Market Consensus
Major financial institutions have published updated 2026–2027 gold price forecasts, reflecting a consensus that structural demand will persist. Goldman Sachs, JPMorgan, and UBS have all highlighted gold's role as a hedge against fiscal dominance and monetary accommodation [monitoring-money.com/blog/gold-price-forecast-2026-major-banks; metalprices.live/gold-price-outlook]. While target prices vary based on differing assumptions regarding USD strength and rate paths, the directional bias across these forecasts aligns with the current upward momentum.
Where sources agree, they emphasize that gold's rally is fundamentally different from past speculative cycles. Unlike margin-driven surges or momentum chases, the current price action is driven by real asset scarcity, central bank buying, and systemic monetary expansion. Where they diverge, it is primarily in timing and magnitude: some institutions assume a faster Fed pivot and project higher near-term targets, while others caution that a sudden strengthening of the dollar or an unexpected economic rebound could trigger sharp corrections. Despite these differences, the institutional positioning continues to favor physical gold and gold-backed instruments as portfolio insurance against tail-risk inflation and systemic monetary expansion.
Strategic Implications: Protecting Wealth in a USD-Denominated System
Allocation Framework
For investors operating within a USD-based financial economy, gold serves as a critical diversifier against currency debasement and inflation mispricing. The current environment—defined by Fed policy paralysis, sticky inflation, and geopolitical shocks—reinforces the need for tangible hedges. A prudent allocation framework typically suggests a core allocation of 5–15% in physical gold or gold-backed ETFs to hedge against tail-risk inflation and systemic monetary expansion. This should be complemented by broader commodity exposures, given the geopolitical tensions and oil price volatility, as well as TIPS for inflation-linked fixed income, real estate for yield generation, and quality equities for long-term growth.
The rationale for this allocation is not speculative but defensive. Gold does not generate cash flow, but it does preserve optionality. In a world where central banks are trapped between inflation and growth, where fiscal deficits continue to expand, and where geopolitical risks threaten supply chains, gold provides a non-correlated asset that performs best precisely when traditional portfolios struggle.
Timing, Volatility, and Psychological Discipline
Gold's current trajectory suggests momentum favors buyers, but the 17.93% gap below the 52-week high indicates that corrections remain possible. Investors should view current levels as a continuation of a multi-year structural bull market rather than a speculative peak. Dollar-cost averaging into positions during volatility spikes offers a disciplined approach to accumulating exposure without overleveraging at local highs. Monitoring real interest rates, central bank flows, and USD index trends can help time entry and exit points, given gold's inherent volatility [westmountfundamentals.com/gold-vs-stocks-historical].
Psychological discipline is perhaps the most critical component. Gold's lack of yield and periodic drawdowns can test investor conviction. Those who treat it as a tactical trade often exit during corrections, only to miss the subsequent recovery. Those who treat it as portfolio insurance maintain their allocation through volatility, recognizing that its value is realized precisely when other assets fail.
What We Know, What We Don't Know, and the Forward Outlook

What We Know:
- Central bank buying is accelerating, with a record 289 tonnes purchased in Q2 2026, up 62% quarter-over-quarter, driven by de-dollarization and fiscal concerns [tftc.io/central-bank-gold-purchases-record-289-tonnes-q2-2026; catenaa.com/markets/global-markets/central-bank-gold-buying-q2-2026/].
- The Fed is trapped: FOMC dissent and sticky Core PCE indicate the central bank cannot hike without breaking the economy, implying prolonged monetary accommodation [fool.com/investing/2026/08/06/fed-august-inflation-forecast-arrived-wall-street/].
- Inflation is persistent: Trailing 12-month CPI at 3.36%, with cumulative PCE index at 131.392 (June 2026), confirming significant purchasing power erosion [in2013dollars.com/current-inflation-rate/current-inflation-rate; fred.stlouisfed.org/series/PCEPI/].
- Gold preserves wealth: Century-long data confirms gold outperforms fiat during inflationary regimes, even if it underperforms equities in low-inflation growth periods [vieclaire.com/en/blog/equities-bonds-and-gold-a-century-of-performance-compared/].
- Geopolitical risks: Oil price volatility and geopolitical fragmentation support commodity and gold exposures as hedges [intellectia.ai/blog/august-cpi-report-fed-decision-2026].
What We Don't Know:
- Whether gold can sustain above $4,500 without a recessionary backdrop.
- How the Fed will respond if inflation reaccelerates despite weak labor data.
- The long-term impact of digital asset competition on traditional safe-haven flows.
- The exact timing of potential corrections remains unpredictable given the asset's sensitivity to shifting rate expectations and geopolitical shocks.
Forward Outlook: The path of least resistance for gold remains upward, supported by fiscal deficits, monetary accommodation, and geopolitical fragmentation. The Fed's inability to resolve the inflation-labor trade-off creates a favorable environment for gold's continued outperformance relative to fiat currencies. However, sharp corrections are likely if the Fed signals aggressive tightening or if economic data unexpectedly strengthens. Investors should view gold as a portfolio insurance policy rather than a directional bet, maintaining discipline through volatility.
Conclusion
Gold's century-long performance validates its role as a premier store of value, particularly when measured against fiat currency depreciation rather than nominal price appreciation. The August 2026 data reveals a macroeconomic environment where the Fed's "not a big deal" narrative is increasingly at odds with FOMC dissent, sticky inflation, and geopolitical supply shocks. This policy trap, combined with a 62% surge in central bank buying and cumulative inflation eroding purchasing power, reinforces gold's structural appeal.
In an era of USD dominance and structural fiscal imbalances, gold offers a proven hedge against inflation mispricing and economic uncertainty. Prudent investors will allocate strategically, recognize gold's regime-dependent performance, and prepare for continued volatility as macro conditions evolve. The evidence suggests that in a world of monetary expansion and geopolitical fragmentation, gold remains the ultimate defense of wealth. For those seeking to protect purchasing power in a USD-denominated system, the answer is not to abandon productive assets, but to recognize that gold's true value lies in its ability to preserve optionality when everything else fails.
Sources

- vieclaire.com/en/blog/equities-bonds-and-gold-a-century-of-performance-compared/
- linkedin.com/pulse/gold-vs-stocks-bonds-historical-comparison-returns-jussi-hyvarinen-tbsbf
- westmountfundamentals.com/gold-vs-stocks-historical
- goldsilver.com/industry-news/article/gold-vs-stocks-bonds-what-the-data-really-suggests/
- goldsilver.com/industry-news/video/gold-vs-stocks-vs-real-estate-what-the-data-shows/
- federalreserve.gov/monetarypolicy/2026-07-mpr-statement.htm
- federalreserve.gov/monetarypolicy/fomcprojtabl20260318.htm
- wallstreeteconomicists.com/articles/federal-reserve-policy-and-inflation-2026
- wallstreeteconomicists.com/articles/fed-policy-path-and-inflation-outlook-2026
- stlouisfed.org/from-the-president/remarks/2026/economic-outlook-monetary-policy-aei
- kitco.com/charts/livegold.html
- mygoldcalc.com/gold-price/2026/08
- usatoday.com/story/money/personalfinance/2026/08/19/gold-price-on-august-19-2026/91367002007/
- naturalresourcestocks.net/metal-charts/gold-price/
- livegoldprice.net/en/gold-price
- gainesvillecoins.com/charts/gold-spot-price
- aurumrates.com/gold-price-forecast-2026
- monitoring-money.com/blog/gold-price-forecast-2026-major-banks
- metalprices.live/gold-price-outlook
- bls.gov/cpi/latest-numbers.htm
- bls.gov/cpi/
- cnbc.com/2026/08/12/cpi-inflation-report-july-2026.html
- in2013dollars.com/current-inflation-rate/current-inflation-rate
- cpiinflationcalculator.com/2026-u-s-inflation-rate-cpi/
- inflationtool.com/rates/usa
- usinflationcalculator.com/inflation/current-inflation-rates/
- keepingupwithinflation.com/inflation-statistics/
- intellectia.ai/blog/august-cpi-report-fed-decision-2026
- fool.com/investing/2026/08/06/fed-august-inflation-forecast-arrived-wall-street/
- fool.com/investing/2026/08/09/federal-reserve-just-released-august-inflation/
- fred.stlouisfed.org/series/PCEPI/
- tftc.io/central-bank-gold-purchases-record-289-tonnes-q2-2026
- metalscost.com/news/central-bank-gold-buying-q2-2026-record-289-tonnes
- catenaa.com/markets/global-markets/central-bank-gold-buying-q2-2026/