

Executive Summary
Over the past century, gold has emerged as the definitive store of value, appreciating approximately 21,114% since 1926 and 10,674% since the U.S. ended the gold standard in 1971 [2]. While the Federal Reserve has frequently characterized inflation as transient, cumulative data reveals profound purchasing power erosion, with the CPI index reaching 332.8 and Core PCE remaining sticky at 3.3% [3, 1]. Gold's correlation with inflation is weak on an annual basis (~0.16) but strong over decadal periods (~0.6+), indicating it hedges cumulative currency debasement rather than month-to-month price spikes [4].
As of August 19, 2026, gold spot bid stands at $4,338.40, reflecting a volatile August where prices ranged from $4,043 to $4,434 [5]. Despite a 30.37% year-over-year gain, the metal is trading roughly 20.33% below its 52-week high of $5,477.79, signaling a consolidation phase within a broader secular bull market [6]. The structural case for gold is bolstered by record central bank purchasing driven by de-dollarization and sanctions immunity, with 95% of surveyed institutions expecting further reserve accumulation [7]. Meanwhile, a divergence between the Fed's official rate path and forward markets pricing hikes to 4% by year-end underscores deep skepticism about inflation control [10]. Current forecasts project gold could reach $4,746–$6,300 through year-end, though investors must navigate daily volatility swings of up to 3.33% and manage position sizing carefully [5].
The Century-Long Verdict: Gold as the Ultimate Store of Value
A Century of Appreciation and Dollar Erosion
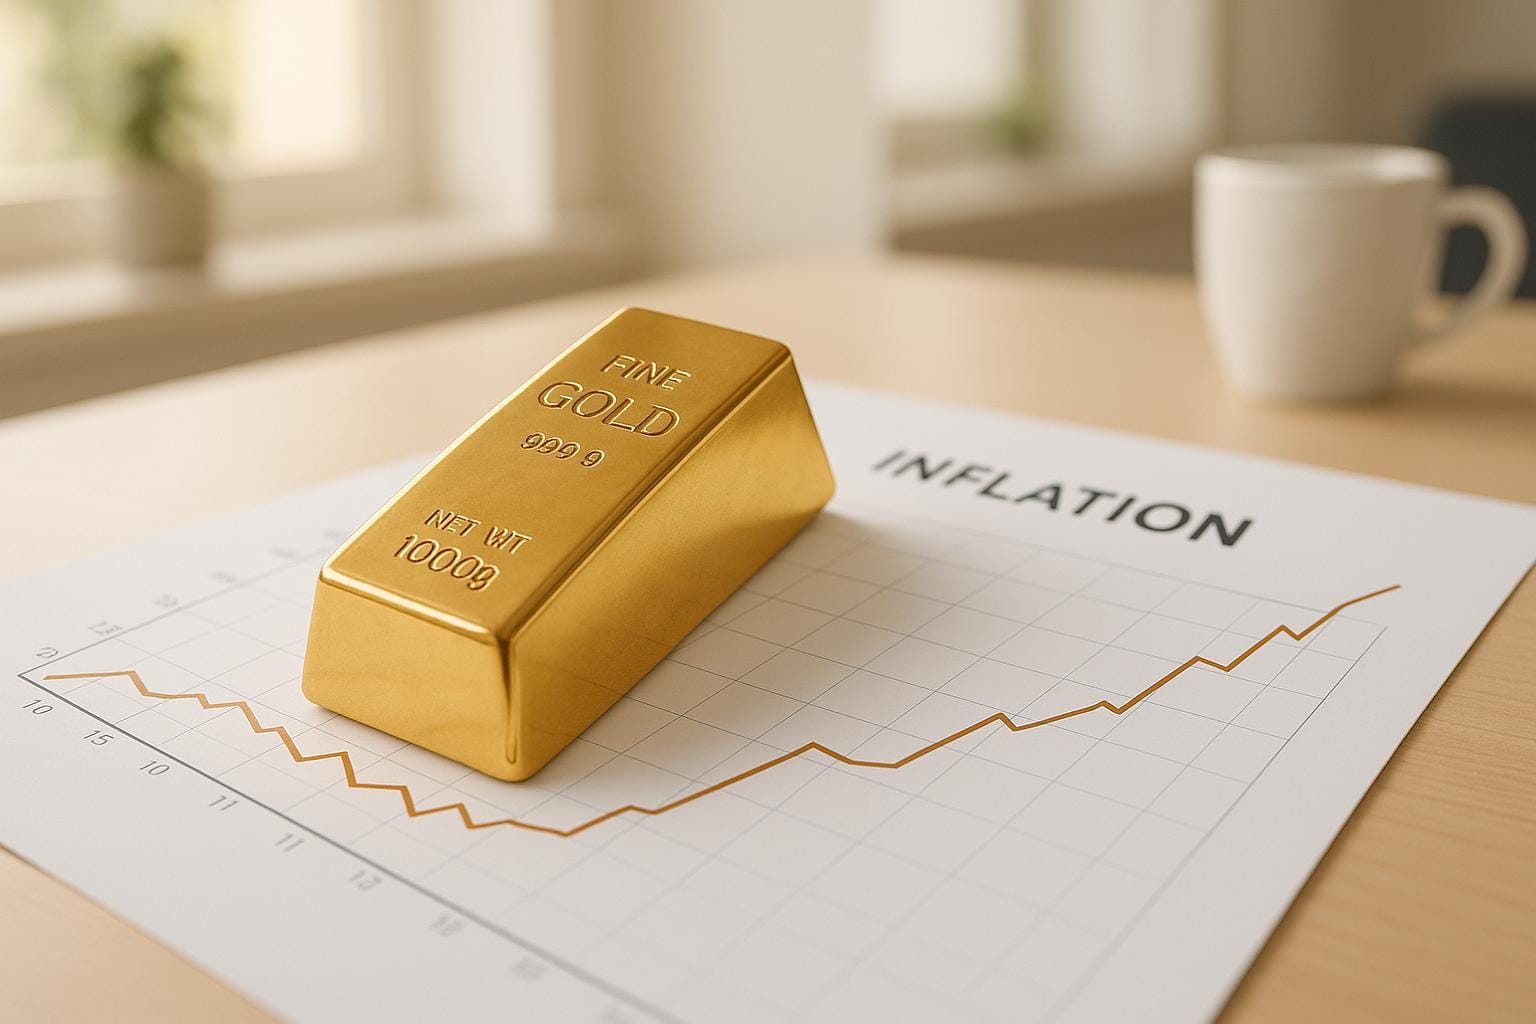
The mathematical evidence regarding gold's performance as a store of value is unambiguous. Over the last century, no major asset class has matched gold's ability to preserve purchasing power against the relentless expansion of fiat currency. Since 1926, gold has appreciated by approximately 21,114% [2]. More critically, since President Nixon severed the dollar's peg to gold in 1971, the metal has surged 10,674% [2]. This appreciation is the inverse of the dollar's decline; every dollar invested at the 1971 gold peg is now worth approximately 108 times its original value in nominal terms, reflecting massive monetary expansion and currency debasement [2].
This long-term trend is not merely a statistical artifact but a reflection of structural shifts in the global monetary system. The dollar's purchasing power has been eroded by decades of fiscal deficits, quantitative easing, and low-interest-rate policies designed to manage debt burdens. Gold acts as a barometer of faith in fiat currency; as confidence in central bank stewardship wavers, capital flows into the metal. The recent momentum reinforces this trend. In 2025, gold posted a 43% annual gain, the strongest performance in over four decades [2]. Over the past decade alone, gold has appreciated by more than 223%, underscoring its effectiveness as a long-term wealth preserver [3].
However, the path has not been linear. Investors must account for significant volatility even within secular bull markets. Historical context reveals notable extremes, including the 1980 inflation-era spike to nearly $850, followed by a two-decade decline to a modern low of $279 in 2000 [2]. These cycles demonstrate that while the long-term trend favors preservation, short-term holders may face substantial drawdowns. The current environment, with gold trading significantly above its decade-ago levels, suggests that the structural drivers supporting gold—negative real yields, geopolitical friction, and sovereign debt concerns—remain potent forces.
Volatility Within the Bull Market
While the long-term data favors gold, the asset's volatility profile demands respect. Daily price swings of up to 3.33% highlight the risk for short-term traders, even as the long-term trend favors wealth preservation [5]. This volatility is not unique to gold but is amplified by the metal's sensitivity to macroeconomic data, central bank communications, and shifts in market sentiment.
The current price action reflects this dynamic. Gold recently hit a 52-week high of $5,477.79 before pulling back to current levels, a correction of over 20% that underscores the asset's susceptibility to sharp swings [6]. Such corrections are typical within bull markets and often serve to shake out leveraged positions before the next leg higher. For long-term investors, these pullbacks can present opportunities, though they require the discipline to withstand short-term noise. The key insight is that gold's value proposition lies in multi-decade horizons, where it consistently outperforms cash and bonds during periods of high inflation and currency debasement [2, 4].
The Inflation Paradox: Decoupling Short-Term Noise from Long-Term Truth
Tracking Debasement, Not Just the CPI
A common misconception among investors is that gold perfectly tracks short-term inflation prints. The data reveals a more nuanced relationship. Gold's correlation with CPI inflation is weak on an annual basis (~0.16) but strong over decadal periods (~0.6+) [4]. This indicates that gold does not necessarily hedge month-to-month inflation spikes but excels at preserving purchasing power against cumulative dollar debasement over decades [4].
This distinction is crucial for investors seeking to protect their wealth. In years where inflation is high but the central bank successfully anchors expectations, gold may underperform in the short term. Conversely, in years where inflation is low but fiscal deficits expand or central banks engage in aggressive easing, gold may rise as investors price in future debasement. Gold acts as a proxy for broad economic instability and fiat currency decline rather than a direct inflation instrument. It captures risks that CPI may understate, including geopolitical tensions, fiscal deficits, and shifts in central bank policy [4].
The cumulative inflation data supports this view. The CPI index stands at 332.8, indicating substantial cumulative inflation since the base period [3]. Core PCE remains elevated at 3.3%, heavily driven by volatile energy prices [1]. Gold's performance suggests that investors have priced in persistent inflationary pressures and currency debasement that official narratives may downplay. The metal's rise is less about the current inflation rate and more about the market's assessment of the central bank's ability to maintain price stability over the long term.
The Fed's Narrative vs. Market Reality
The interplay between Federal Reserve policy and gold prices is complex. The Fed drives gold through two primary mechanisms: the opportunity cost of holding non-yielding assets (real interest rates) and the strength of the US Dollar. Rate hikes historically suppress gold prices, while quantitative easing and low-rate environments correlate with surges as investors seek inflation hedges [3, 7].
As of mid-2026, the Fed has held the federal funds rate steady at 3.50%–3.75%, citing persistent inflation above the 2% target and resilient growth [5, 8]. While official projections suggest a gradual easing path toward 3.4% by year-end, forward markets are pricing in rates reaching 4% [10]. This divergence highlights growing market skepticism about the Fed's ability to tame inflation without economic contraction. New Chair Kevin Warsh has established internal task forces to review decision-making, potentially delaying policy shifts [15].
Despite political pressure, 87% of Fed watchers oppose raising the inflation target from 2%, maintaining the institutional commitment to price stability [14]. However, 75% rate the threat to Fed independence as high, closely tied to managing political pressure and maintaining a clear reaction function to return inflation to target [14]. While 77% believe the current balance sheet size is not a problem, there is notable concern regarding the "ample reserves" framework and potential changes under new leadership [14].
This environment of uncertainty favors gold. Traditional fixed-income investments are offering low or negative real returns due to the gap between nominal yields and inflation. This dynamic is driving capital toward gold as a superior hedge against currency debasement [3]. Investors seeking income are increasingly turning to bond ladders and intermediate maturities to manage rate risk, but the real return deficit makes gold's zero-yield profile less of a disadvantage [15]. The market's pricing of higher rates reflects a belief that the Fed may need to tighten further to combat sticky inflation, which could paradoxically support gold if it signals a loss of confidence in the dollar's stability.
The Structural Floor: Central Banks and the De-Dollarization Shift

Sovereign Demand Reshaping the Market
A primary driver of gold prices in 2026 is sustained central bank purchasing. Global institutions continue to accumulate gold to diversify reserves away from the USD, creating a structural floor for prices [1, 7]. Following the 2022 freezing of Russian reserves, emerging markets actively reduced USD exposure, pushing purchases to post-WWII highs [10]. Major holders like China continue "catching up" to target reserve allocations, requiring demand equivalent to over a year of global mine supply to meet strategic goals [10].
This trend is not cyclical but structural. Forward-looking data indicates this trend will persist, with 95% of surveyed central banks expecting further increases in official gold reserves [7]. The motivation is clear: gold offers sanctions immunity and does not rely on the creditworthiness of any single counterparty. In a world of fragmented geopolitics and weaponized finance, gold serves as a neutral reserve asset.
The implications for gold prices are profound. Central bank buying reduces the available supply of the metal, tightening the market and supporting prices even during periods of weak retail demand. This demand is inelastic; central banks are not trading gold based on short-term price signals but are executing long-term strategic allocation decisions. As a result, gold's price floor has shifted higher, and corrections are likely to be bought aggressively by sovereign institutions.
De-Dollarization and the Dollar's Role
Gold continues to rise even with a moderately strong DXY (~99.5), suggesting that factors beyond dollar weakness—such as real interest rates, safe-haven demand, and global uncertainty—are propelling the metal [3]. The dollar remains the world's reserve currency, but its dominance is being eroded by a combination of fiscal irresponsibility, sanctions policy, and the rise of alternative financial architectures.
Gold's performance in this context is a vote of no confidence in the long-term sustainability of the current monetary order. As central banks diversify into gold, they are effectively reducing their reliance on USD-denominated assets. This shift is gradual but irreversible, and it provides a tailwind for gold prices that is unlikely to dissipate in the near term. Investors should view central bank demand as a structural support that enhances gold's appeal as a portfolio hedge.
Current Market Dynamics: Volatility, Correction, and Opportunity
Price Action and the 52-Week Context
As of August 19, 2026, gold spot bid is $4,338.40, with a daily range of $4,324.10 to $4,362.90 [1]. Gold exhibited strong upward momentum in August, rising 7.96% from $4,043.36 to $4,365.03 by mid-month, with a range of $4,043 to $4,434.52 [5]. Weekly performance showed acceleration in early August (+7.39% for the week of Aug 3) followed by consolidation [5].
The current price remains significantly below the 52-week high, suggesting a correction phase within a broader uptrend [6]. This correction offers a potential entry point for investors who missed the earlier rally, though it also underscores the asset's volatility. The pullback from $5,477.79 represents a loss of over $1,100 per ounce, a significant drawdown that would have tested the resolve of many holders. However, the YoY gain of 30.37% demonstrates that the long-term trend remains intact [6].
Forward Guidance and the Path to $6,300
Analysts project gold could trade between $4,746 and $6,300 through the remainder of 2026, supported by sustained central bank buying, inverted yield curves, and persistent inflation expectations [9]. The inverted yield curve, a reliable recession indicator, has historically impacted gold prices, with recessionary signals often coinciding with periods where gold outperforms risk assets [5, 8].
Research from the San Francisco Fed indicates that forward guidance and communication strategies often move markets preemptively by shaping expectations of future policy. Gold is highly sensitive to anticipated shifts in monetary stance, meaning price action may reflect expected future rate cuts or hikes before they are enacted [4, 6]. Investors should monitor Fed communications closely, as forward guidance often moves gold prices preemptively, offering clues to future monetary direction.
Access to gold can be achieved through physical assets, ETFs, or mining stocks, though risks and premiums should be considered [6]. Physical gold often carries premiums during periods of high demand and volatility. Commodities carry significant risks, including market price fluctuations and adverse political or financial factors [8]. Investors should also consider the tax implications and storage costs associated with physical gold, as well as the counterparty risk inherent in paper gold products.
What We Know and What We Don't: A Balanced Assessment

Knowns
- Gold has preserved purchasing power over centuries, outperforming cash and bonds during periods of high inflation and currency debasement [2, 4].
- The long-term correlation with cumulative inflation is strong, making gold a reliable hedge for multi-decade horizons [4].
- Current macro conditions—negative real yields, elevated Core PCE (3.3%), geopolitical risk, inverted yield curves, and central bank buying—favor gold [1, 3, 5, 8].
- Central bank demand is structurally elevated, with 95% of institutions expecting further reserve accumulation and China's catch-up phase requiring demand exceeding one year of global mine supply [7, 10].
- Gold reduces portfolio volatility and offers diversification benefits [4].
- Market movements are often driven by Fed forward guidance and sentiment regarding future policy rather than immediate rate changes [7].
- Gold is currently trading ~20% below its 52-week high, indicating that even in a bull market, significant corrections can occur [6].
- The Fed maintains a 2% inflation target, but market pricing suggests deeper structural inflationary pressures that official projections may understate [5, 9, 10].
Unknowns
- Short-Term Correlation: Gold's annual correlation with CPI is weak, meaning it may underperform in specific years even during inflationary periods [4].
- Policy Shifts: Changes in Federal Reserve policy, interest rate trajectories, and dollar strength could alter gold's trajectory in the near term [5]. The divergence between official easing projections and forward market pricing of 4% adds uncertainty [10].
- Sentiment Risks: Gold is sensitive to market sentiment; a sudden risk-on environment or resolution of geopolitical tensions could dampen demand [4].
- Volatility Management: Daily swings of over 3% require robust risk management; short-term trading carries significant risk even if the long-term trend is up [5].
- Past Performance: While historical data is compelling, past performance does not guarantee future results due to shifting market conditions [6].
Conclusion: The Verdict for the Modern Investor
Gold remains the premier store of value for protecting wealth against inflation and currency debasement. The data is unambiguous: over the last century, gold has appreciated exponentially while the dollar's purchasing power has eroded. While short-term volatility and weak annual inflation correlation require patience, gold's decadal performance and current macro tailwinds make it a compelling asset for investors seeking to safeguard purchasing power.
Current market dynamics show gold trading around $4,338, volatile but structurally supported by record central bank buying, inverted yield curves, and persistent inflation expectations. The metal is currently 20% below its 52-week high, reminding investors that even secular bull markets include sharp corrections. The Federal Reserve holds rates at 3.50%–3.75%, but forward markets are pricing in hikes to 4%, reflecting deep skepticism about inflation control and rising concerns over Fed independence.
For those looking to protect against a USD-based financial economy built on debt and debasement, gold offers a time-tested hedge, though position sizing and volatility tolerance must be carefully managed. Investors should also monitor Fed communication closely, as forward guidance often moves gold prices preemptively, offering clues to future monetary direction. The structural case for gold has never been stronger, with central banks diversifying reserves and the market pricing in a future of higher inflation and fiscal stress. While short-term traders may face whipsaws, long-term holders are rewarded with the preservation of wealth in an era of monetary experimentation.
Sources:
[1] Policy Circle - What will drive gold prices in 2026 and beyond
https://www.policycircle.org/economy/gold-price-central-bank-demand-gold-and-interest-rates/
[2] Swiss America - Gold Price History Chart 100 Years (1926 to 2026)
https://blog.swissamerica.com/gold-price-history-chart-100-years/
[3] Gold Price Data - Gold Price Forecast 2026: Targets, Trends & Market Analysis
https://www.goldpricedata.com/en/gold-price-forecast/
[4] Goldetect - Gold as Inflation Hedge — Annual vs Decadal CPI Correlation
https://goldetect.com/en/gold-vs/inflation-cpi
[5] MyGoldCalc - Gold Price August 2026
https://mygoldcalc.com/gold-price/2026/08
[6] USA Today - Gold Price Today on August 13, 2026
https://www.usatoday.com/story/money/personalfinance/2026/08/13/gold-price-on-august-13-2026/91283958007/
[7] NaturalResourceStocks - Gold Price Today | Gold Spot Price Charts
https://naturalresourcestocks.net/metal-charts/gold-price/
[8] GoldSilver - Gold Price Outlook August 2026
https://goldsilver.com/industry-news/article/gold-price-outlook-august-2026/
[9] KITCO - Gold Price Today | Gold Spot Price Charts - Aug 18, 2026
https://www.kitco.com/charts/livegold.html
[10] Federal Reserve Board - Monetary Policy Report July 2026
https://www.federalreserve.gov/monetarypolicy/2026-07-mpr-statement.htm
[11] San Francisco Fed - Fed Communications and Inflation Expectations (March 2026)
https://www.frbsf.org/research-and-insights/publications/economic-letter/2026/03/fed-communications-and-inflation-expectations/
[12] WallStreetEconomicists - Federal Reserve policy and inflation 2026: Markets in Focus
https://wallstreeteconomicists.com/articles/federal-reserve-policy-and-inflation-2026
[13] US Bank - Situation Analysis: Fed holds rates steady (June 17, 2026)
https://www.usbank.com/content/dam/usbank/en/documents/pdfs/wealth-management/situation-analysis-6-17-2026.pdf
[14] Brookings - Grading Fed communications: A 2026 survey of Fed watchers
https://www.brookings.edu/articles/grading-fed-communications-a-2026-survey-of-fed-watchers/
[15] iShares - Fed Outlook 2026: Rate forecasts and fixed income strategies
https://www.ishares.com/us/insights/portfolio-insights/fed-outlook-rates-kevin-warsh-fixed-income-2026
[16] World Gold Council - Central Banks | Gold Demand Trends Full Year 2025
https://www.gold.org/goldhub/research/gold-demand-trends/gold-demand-trends-full-year-2025/central-banks
[17] Informed Clearly - Central Banks Ditch Dollar for Gold: Reserve Shift 2026
https://informedclearly.com/en/economy/49482/central-banks-gold-dollar-reserve-shift-2026
[18] XAUS - Central Bank Gold Reserves by Country 2026, Tonnes
https://xaus.com/data/reserves/
[19] The Middle East Insider - Central Banks Buying Gold at Record Pace in 2026: Data, Analysis
https://themiddleeastinsider.com/2026/04/01/central-banks-buying-gold-2026-record-reserves-analysis/
[20] Mantra Blog - Central Bank Gold Buying 2025 | De-Dollarization Analysis
https://www.mantramint.com/blog/central-banks-buying-gold-2025