
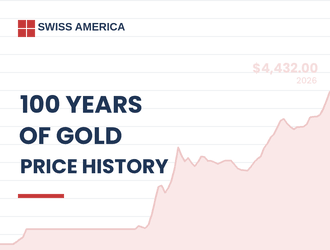
Gold’s reputation as humanity’s oldest store of value is undergoing a modern reevaluation. Over the past century, it has delivered modest real returns averaging 0% to 3% annually, consistently underperforming equities in nominal wealth creation until the late 1990s. Yet, in an era defined by persistent inflation, restrictive monetary policy, and geopolitical fragmentation, gold has emerged as the premier defensive asset. The past decade has seen double-digit compounded returns, including a 61% surge in 2025 and a spot price of $4,376.51 as of mid-August 2026. While the Federal Reserve maintains that inflation expectations remain anchored and no rate hikes are necessary, bond markets are pricing in a 77% probability that rates will remain between 3.5% and 3.75% through 2026. This divergence between official narratives and economic reality, coupled with aggressive central bank accumulation and de-dollarization trends, has propelled institutional targets toward $4,900 per ounce. For individuals navigating a USD-dominated financial system, gold is not a growth engine but a critical security boundary—a hedge against currency erosion, policy stagnation, and the gap between headline inflation metrics and household budgets. This report synthesizes historical performance, current macro dynamics, and forward-looking structural drivers to determine whether gold truly earns its place in a prudent wealth preservation strategy.
Introduction: The Quest for a True Store of Value
The question of what constitutes a reliable store of value is as old as commerce itself. For millennia, gold has served as humanity’s monetary anchor, transitioning from coinage to central bank reserves to modern portfolio allocations. Today, as fiat currencies face unprecedented monetary expansion and geopolitical realignments, the conversation has shifted from whether gold can preserve wealth to whether it should occupy a dedicated space in diversified portfolios. The Federal Reserve’s recent communications have attempted to calm markets, with Chair Jerome Powell repeatedly emphasizing that inflation expectations remain well anchored and that temporary energy price fluctuations do not warrant policy tightening. Yet, for everyday consumers, the cost of living continues to outpace official metrics, and the dollar’s purchasing power erodes steadily. In this environment, gold’s role as a “security boundary” becomes less about speculation and more about survival. This report investigates gold’s century-long performance record, the Fed’s inflation narrative versus on-the-ground reality, current market drivers pushing prices toward institutional targets, and the strategic implications for individuals seeking to protect wealth in a USD-centric economy. By synthesizing historical data, macroeconomic indicators, and forward-looking analyst forecasts, we can determine whether gold’s recent momentum represents a cyclical anomaly or a structural evolution in global finance.
A Century of Performance: Preservation vs. Growth
The Long Arc: Gold vs. Equities and Bonds
Evaluating gold as the “best store of value” requires a fundamental distinction: wealth generation versus wealth preservation. Over the past century, gold has delivered real returns averaging between 0% and 3% annually. This modest performance is not a flaw but a feature—it tracks inflation rather than generating excess real growth. Since 1926, gold has appreciated approximately 21,114%, and since the U.S. severed its link to the gold standard in 1971, it has risen 10,674% Finding 1. However, this long-term appreciation masks a critical historical reality: prior to 1998, the S&P 500 consistently outperformed gold in both nominal and real terms. Equities generated compound annual growth rates that dwarfed gold’s inflation-matching trajectory, making them the clear choice for wealth builders during decades of relative monetary stability and low inflation.
The dynamic shifted dramatically in the post-2008 era, accelerating after 2016. Gold has maintained double-digit compounded returns for investments dating back to that period, significantly outperforming equities during cycles marked by quantitative easing, fiscal stimulus, and geopolitical uncertainty. This reversal has led market observers to conclude that gold has “earned a portfolio allocation” due to its recent exceptional performance Finding 4. The asset’s true value, however, is not realized in bull markets but during systemic stress. Comparative analyses of stocks, bonds, and real estate confirm that while equities generate higher nominal returns in stable environments, gold provides superior risk-adjusted returns during inflation spikes, currency crises, and geopolitical turmoil Finding 3. Its zero-counterparty-risk profile and high liquidity make it the only asset class that consistently preserves purchasing power when other assets face drawdowns.
The Modern Renaissance: Double-Digit Returns and Crisis Resilience
The past few years have cemented gold’s modern renaissance. The average gold price in 2025 was $3,431, representing a 43% gain over 2024—the strongest annual increase in over four decades Finding 7. As of mid-August 2026, the spot price stands at $4,376.51, reflecting unprecedented levels driven by a confluence of structural forces Finding 1. This acceleration is not merely cyclical; it reflects a fundamental reassessment of gold’s role in an era of fiscal dominance and monetary uncertainty. While equities and real estate generate yield and cash flow, gold generates none of the above. Its return is purely capital appreciation driven by scarcity, demand shifts, and currency debasement fears. This characteristic makes it uniquely suited as a defensive anchor rather than a growth engine. Investors who view gold through the lens of traditional valuation metrics will inevitably be disappointed, but those who recognize it as a purchasing power preservation tool will find its recent performance entirely consistent with its historical mandate.
The Inflation Paradox: Fed Narratives vs. Household Reality
Anchored Expectations and the "In Check" Narrative
The Federal Reserve’s current stance presents a complex backdrop for gold. Chair Powell has repeatedly stated that inflation expectations remain well anchored and no rate hikes are needed, pointing to low Treasury breakeven rates and temporary energy price fluctuations as evidence of monetary stability Finding 9. The five-year Treasury breakeven rate has trended lower, suggesting that financial markets show minimal fear of an immediate inflation spike. Yet, this narrative clashes with the reality of restrictive policy persistence. The Fed is unlikely to cut rates in 2026, with bond markets pricing a 77% probability that rates remain between 3.5% and 3.75% Finding 10. New energy supply shocks from geopolitical conflict have entrenched inflationary pressures, leading officials to emphasize vigilance over relaxation. The March 2026 projections show headline PCE inflation at a median of 2.7% for 2026, with a range up to 3.3%, indicating that inflation remains stubbornly above the Fed’s 2.0% target Finding 2.
The Gap Between Core PCE and the Kitchen Table
The Fed’s reliance on core PCE, which excludes volatile food and energy prices, creates a persistent gap between official metrics and household budgets. For gold investors, this gap validates tangible hedges, as consumers face cost pressures that may not be fully captured in policy-focused inflation measures Finding 8. A family paying higher grocery bills, energy costs, and insurance premiums experiences inflation far more acutely than a portfolio manager tracking core PCE. This divergence underscores gold’s utility as a protection against the real-world consequences of cost-push inflation and policy stagnation. While financial market indicators show no immediate fear of an inflation spike, the physical economy tells a different story. Gold thrives in this environment because it hedges not just headline inflation, but the erosion of real wages, the stagnation of purchasing power, and the risks of prolonged monetary restriction. The Fed’s “in check” narrative may soothe bond traders, but it does little to comfort consumers watching their cost of living outpace their income.
Structural Tailwinds: Why Gold Is Climbing Toward $4,900

Central Bank Accumulation and De-Dollarization
Gold’s trajectory is underpinned by structural forces that extend beyond cyclical inflation hedging. The most significant driver is aggressive central bank accumulation aimed at diversifying away from USD reserves. This structural shift reduces reliance on the dollar and increases demand for gold as a neutral, sovereign-backed asset. The trend reflects a long-term reallocation of global reserves toward hard assets, driven by sanctions risk, currency weaponization fears, and a desire for monetary sovereignty Finding 6. Central banks are not trading gold for short-term gains; they are restructuring the global monetary architecture. This behavior provides a price floor and reduces the asset’s sensitivity to short-term interest rate fluctuations, as sovereign demand operates on multi-decade horizons.
Geopolitical Volatility and the Safe-Haven Premium
Persistent geopolitical tensions and tariff-induced market volatility continue to drive investors toward safe-haven assets. Gold’s price movements remain inversely correlated with economic stability, surging during periods of systemic risk Finding 1. The institutional consensus on a $4,900 per ounce target by end-2026, reaffirmed by Goldman Sachs, cites rising structural buying and gold’s growing function as a strategic portfolio diversifier Finding 2. Similarly, Kitco analysis emphasizes that sovereign demand will continue to drive prices upward, noting that “gold is not done” Finding 1. While short-term volatility persists due to interest rate sensitivity and dollar strength, the underlying drivers suggest continued strength. The convergence of de-dollarization, trade fragmentation, and fiscal dominance creates a multi-year tailwind that positions gold for sustained appreciation.
Navigating the Volatility: What Should Investors Do?
Positioning for Wealth Preservation in a USD-Dominated World
In a USD-dominated financial economy, protecting wealth requires acknowledging the risks of currency erosion, policy uncertainty, and the limitations of traditional assets. Given gold’s double-digit returns since 2016 and its role in crisis preservation, it has earned a dedicated allocation in diversified portfolios Finding 4. A balanced approach combining gold, productive assets, and liquidity is recommended for comprehensive wealth preservation. For those exposed to the USD, gold offers a direct hedge against currency devaluation. As central banks diversify away from the dollar, gold’s role as a neutral reserve asset becomes more pronounced, making it a strategic counterweight to fiat exposure.
Managing Short-Term Swings vs. Long-Term Trends
Investors should be aware of cyclical headwinds, such as rising interest rates, which can cause short-term price corrections. However, the long-term trend favors gold, and volatility may present buying opportunities. Position sizing and dollar-cost averaging can mitigate timing risk Finding 6. Gold addresses risks that other assets may not, including inflation, currency devaluation, and geopolitical instability. It protects against scenarios where official inflation measures understate true cost-of-living increases or where monetary policy shifts erode real returns on cash and bonds Finding 3. The key is to view gold not as a speculative trade but as an insurance policy against systemic monetary and geopolitical failure.
What We Know, What We Don’t, and Where the Risks Lie
The current gold market is characterized by a clear consensus on long-term structural drivers, but significant uncertainty regarding short-term dynamics. We know that gold has delivered modest real returns averaging 0% to 3% annually over the last century, with a 61% surge in 2025 and double-digit returns since 2016, leading to a consensus that it has “earned a portfolio allocation” Finding 4. We know that current PCE inflation is projected at 2.7% for 2026, with a range up to 3.3%, indicating inflation remains above the Fed’s 2.0% target Finding 2.