
Gold as a Store of Value: A Century of Performance, Inflation, and the Path Forward
Executive Summary
Over the past century, gold has emerged not merely as a precious metal but as humanity's most reliable anchor against the slow erosion of purchasing power. As of mid-August 2026, gold trades near $4,377 per troy ounce, reflecting an 8.24% monthly gain and a trading range of $4,043 to $4,434. This price action occurs against a backdrop of persistent macroeconomic tension: Q2 2026 GDP growth has slowed to 1.5%, the PCE price deflator remains sticky at 6.3%, and the Federal Reserve's July meeting ended in a "nail-biter" with three dissents favoring rate hikes. In a global financial system structurally built on the US dollar, where fiat currencies continue to lose value despite a strong dollar index, gold functions as critical insurance. Central banks have accelerated purchases—adding approximately 1,200 tonnes in 2025 and 244 tonnes in Q1 2026—signaling deep confidence in gold's strategic role. This report synthesizes historical data, current market dynamics, and forward-looking structural demand to evaluate gold's relevance, address its volatility, and outline what investors can and cannot expect. The conclusion is clear: gold is not a speculative growth engine, but a disciplined allocation for wealth preservation that has earned its status as the best store of value over the last century.
Introduction: The Golden Shield in a Turbulent Economy
The question of how to protect wealth in an era of monetary uncertainty is as old as currency itself. Yet, as we navigate the economic landscape of August 2026, the answer points decisively toward a metal that has been revered for millennia. While the Federal Reserve and mainstream financial narratives often attempt to normalize inflation, the lived reality for consumers and investors tells a different story. With core services prices elevated, energy markets volatile due to geopolitical shocks, and short-term inflation expectations spiking to 4.6%, the gap between official messaging and economic reality is widening.
In this environment, gold's role has evolved. It is no longer just a reactive hedge against sudden crises; it has become a structural component of portfolio defense. The metal's recent performance—posting double-digit percentage gains in certain rolling periods while equities face margin compression and bonds struggle to outpace the PCE deflator—underscores a fundamental truth. In a USD-denominated financial system where the purchasing power of paper currency continues to decline, gold offers a counterweight that no central bank balance sheet can replicate. This report investigates the evidence behind gold's century-long dominance as a store of value, examines the current "stagflationary" dynamics driving prices, and provides a strategic framework for investors seeking to protect themselves.
A Century of Truth: Gold's Performance Against Inflation and Fiat
To determine whether gold has truly been the best store of value over the last century, we must look beyond short-term price charts and analyze long-term data across multiple asset classes. The historical record is robust and unambiguous.
Real Returns and Inflation Protection
From 1928 to 2024, gold delivered an average annual return of +5.12%, comfortably outpacing the historical average inflation rate of approximately 3% [1]. This generates a positive real return of roughly 2.12% annually, a figure that may seem modest but is profound when compounded over decades. More importantly, gold has consistently maintained a positive real return against inflation across rolling periods, with average annual returns ranging from 4.5% over 10-year horizons to 9.2% over 20-year horizons [2].
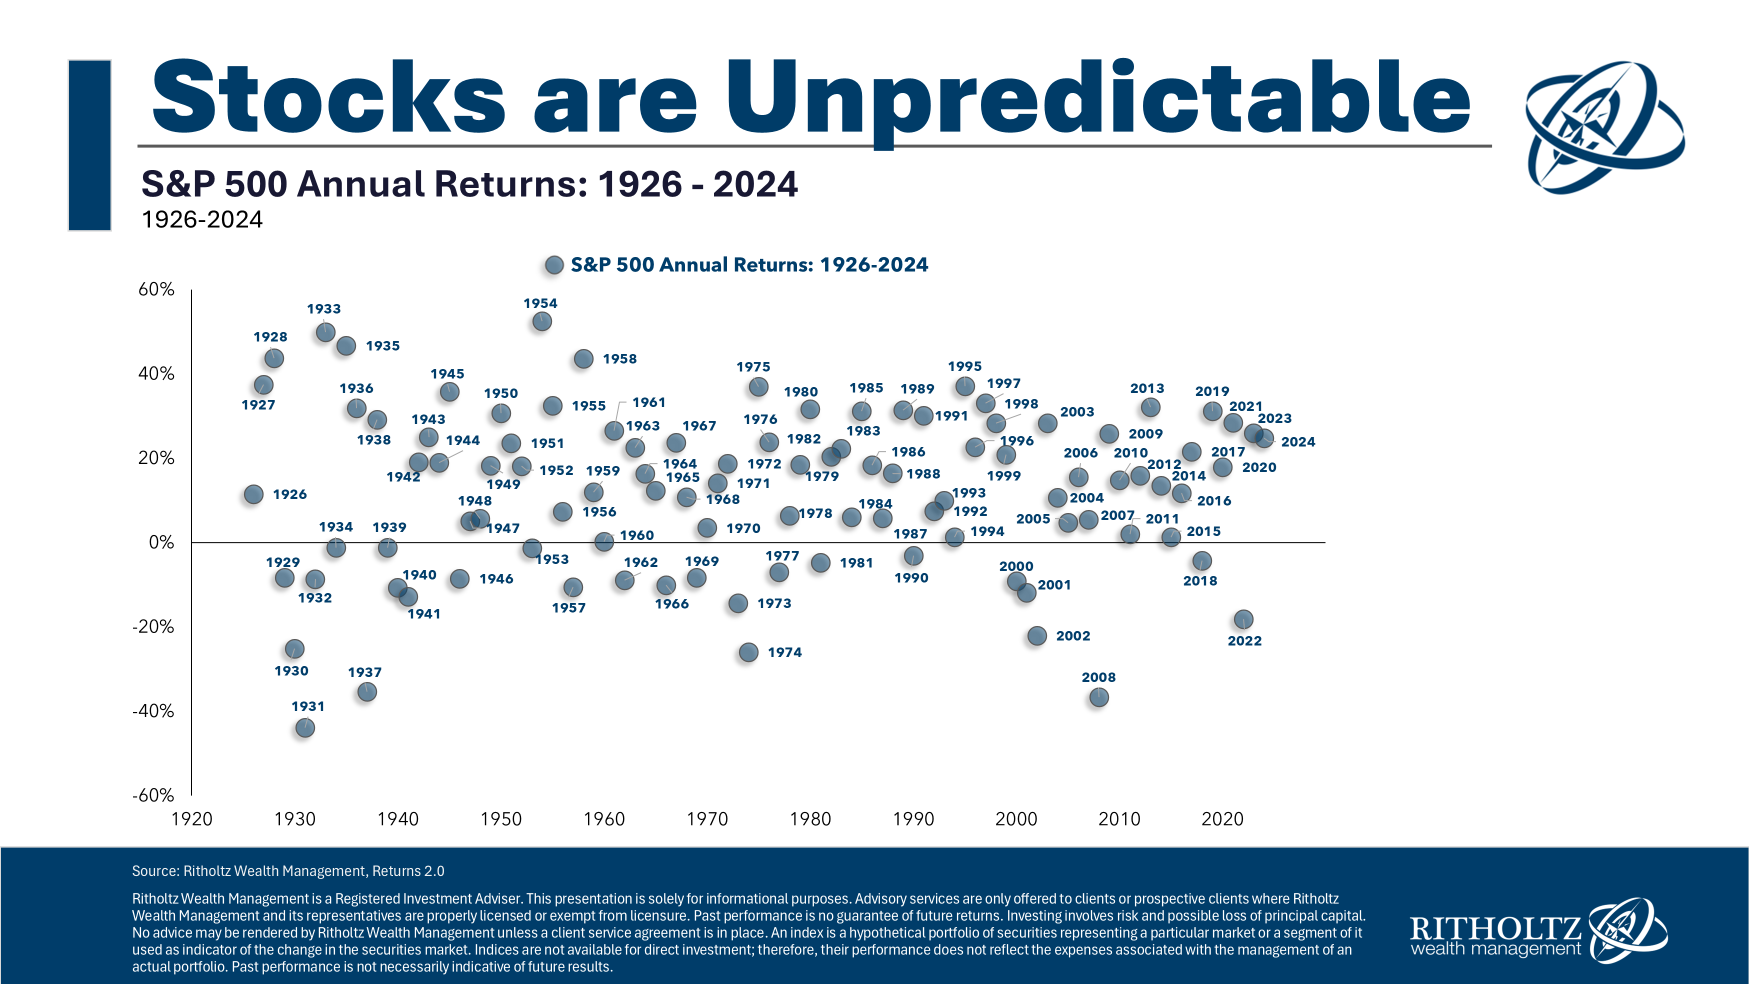
In contrast, the US Dollar Index and US bonds have shown negative real returns of -0.5% over 50 years [2]. While equities (S&P 500) historically yield higher annual returns across all measured periods, they come with significantly higher volatility and sequence-of-returns risk. Gold excels in wealth preservation rather than high-growth accumulation. It has delivered double-digit annual returns in three of the past six decades, though its performance is highly cyclical, reinforcing the need for diversification over concentration [3].
Gold vs. The 21st Century Landscape
In the 21st century, gold has been the best-performing US asset class behind only commercial real estate investment trusts (REITs) [5]. This distinction highlights gold's ability to thrive even in environments dominated by financial innovation and digital assets. While the narrative often pits gold against "risk-on" assets, the data suggests that gold's leadership shifts unpredictably by decade, making it an essential diversifier regardless of the prevailing market regime [3].
Key Takeaway: Gold has not just survived the last century; it has preserved purchasing power while cash and bonds lost it. Its average annual return of +5.12% against ~3% inflation confirms its status as a viable, variable store of value, though annual unpredictability masks this long-term stability.
The Inflation Paradox: Fed Policy vs. Economic Reality
The Federal Reserve's stance on inflation has been a focal point of debate. While the Fed has held rates unchanged in July 2026, describing the situation with measured language, the underlying data reveals a more complex picture. The "not a big deal" narrative clashes with the reality of sticky prices and a divided policy committee.
The Data: Sticky Prices and Slowing Growth
The Bureau of Economic Analysis reported Q2 2026 GDP growth at 1.5%, signaling a notable slowdown that raises concerns about stagflation. Compounding this, the PCE price deflator—a broader inflation gauge preferred by the Fed—registered a persistent 6.3% [3, 5, 7]. The July CPI report showed consumer prices rising 0.1% month-over-month, translating to an annual rate of 3.4%, with energy prices moderating but core services remaining elevated [4, 8].
The San Francisco Fed's July 2026 analysis confirms that short-term inflation expectations have spiked to 4.6%, signaling heightened near-term price volatility [4, 10]. For retail investors, this means traditional fixed-income yields may not outpace inflation, and cash continues to lose purchasing power over time.
The "Nail-Biter" FOMC Meeting
The July FOMC meeting, described by market observers as a "nail-biter," highlighted internal fractures over the appropriate policy response [1, 2, 23]. While the Fed held rates steady, three dissents favored hikes, underscoring a deeply divided policy committee struggling to balance persistent price pressures against weakening growth [1, 2, 23]. This division suggests that the Fed's public calm may mask significant internal anxiety about the trajectory of prices.
The disconnect between official messaging and lived economic reality is precisely why hard assets like gold remain a critical protective tool. Monetary policy operates with lags, and by the time rate cuts materialize, the damage to real wages and savings may already be done. Gold's role as an inflation hedge is empirically supported, though annual performance is volatile, making long-term holding essential [3].
The USD Dilemma and the Central Bank Gold Rush
The global financial economy remains structurally built on the US dollar. While the USD has appreciated modestly and remains strong in real terms, cash continues to lose purchasing power to inflation over time [6]. This dynamic creates a paradox: a strong dollar can temporarily suppress gold prices, yet the underlying erosion of fiat purchasing power makes gold's role as a counterweight increasingly relevant [9].
Central Banks: The Smart Money is Buying
This structural shift is most visible in central bank behavior. In 2025, global central banks added approximately 1,200 tonnes of gold to their reserves, marking one of the most aggressive buying cycles in decades [7, 8]. The trend accelerated in Q1 2026, with central banks purchasing 244 tonnes—a significant quarter-over-quarter increase driven by explicit diversification away from fiat-heavy reserves and heightened geopolitical hedging [10].
Institutional analysts note that this sustained accumulation reflects deep confidence in gold's strategic value as a non-sovereign, liquid reserve asset [9]. For investors operating in a USD-based system, gold functions less as a growth engine and more as an insurance policy against the slow devaluation of paper currency, monetary regime shifts, and the volatility of traditional fixed-income assets [2].
Agreement Across Sources: Both sovereign buyers and private investors are converging on the same conclusion: gold is a critical component of resilience. The central bank buying provides a durable price floor and reduces available supply, while retail and institutional demand reflect a broader recognition of monetary risks.
August 2026: Volatility, Momentum, and the Path to $4,900?
Gold has exhibited pronounced volatility while maintaining a clear upward bias, recently performing strongly alongside equities [3]. As of August 14, 2026, the spot price sits near $4,376.50 per ounce, reflecting an 8.24% monthly gain and weekly advances of 7.39% followed by 0.79% [6]. The metal's trading range of $4,043 to $4,434 highlights persistent intraday volatility, with swings of up to 3.33% occurring within single sessions [6].
Drivers of Current Price Action
This price action is driven by a convergence of structural tailwinds:
- Stagflationary Dynamics: Q2 2026 GDP growth of 1.5% paired with a 6.3% PCE deflator creates an environment where traditional bonds underperform and equities face margin compression, elevating gold's safe-haven appeal [1, 4, 7].
- Central Bank Structural Demand: The 1,000+ tonne annual buying pace and Q1 2026 acceleration provide a durable price floor and reduce available supply [7, 10].
- Inflation Persistence: Short-term expectations at 4.6% keep real yields under pressure, favoring hard assets [8, 10].
- Geopolitical & Energy Shocks: Middle East conflict-driven energy price surges and tariff policies sustain safe-haven demand [8].
- Technical Momentum: August 2026 price action shows gold testing key resistance levels, with institutional strategies focusing on breakout confirmation and support at $4,000–$4,050 [8, 10].
Forward-Looking Models and Risks
Forward-looking models suggest potential upside targets near $4,900 if structural demand and stagflationary pressures persist, though CFD trading dynamics indicate that short-term volatility can amplify drawdowns before trend confirmation [4, 5]. However, headwinds exist. Rising real interest rates and a resilient USD can create short-term drawdowns. Gold's historical volatility means that even in a secular uptrend, corrections of 10-15% are common and often precede further gains.
The Fed's divided stance on rates adds another layer of uncertainty: if real yields remain elevated longer than expected, gold may experience periodic liquidity-driven sell-offs before reasserting its inflation-hedge role. Investors should expect continued whipsaw price action, with momentum heavily dependent on upcoming inflation prints and Fed communication.
Strategic Playbook: How to Position Yourself
For investors seeking to protect themselves in a USD-centric system with persistent inflation, gold offers a proven solution. However, the approach must be disciplined.
Allocation and Diversification
- Gold is a hedge, not a growth asset. It preserves purchasing power but historically underperforms equities over full market cycles [2].
- Diversification remains paramount. A core portfolio of stocks, bonds, and REITs should form the foundation; gold is most beneficial for investors who lack commodity exposure [6].
- Allocation guidelines. Historically, 5-15% of a diversified portfolio allocated to gold or gold-backed instruments provides meaningful inflation protection without overconcentrating risk [1].
- Time horizon matters. Annual unpredictability makes short-term timing less reliable than long-term holding, especially during inflationary regimes [3].
Technical Levels and Position Sizing
- Watch technical levels. With gold trading near all-time highs, breakout confirmation above $4,400 could trigger momentum toward $4,900, while a pullback to the $4,000 support zone may offer accumulation opportunities [1, 3, 8, 10].
- Position sizing for volatility. Given the 3%+ daily swings and potential for rapid reversals, investors should size positions to withstand short-term drawdowns without forcing panic exits [5].
- Monitor central bank flows. Sustained sovereign buying signals long-term structural demand and can dampen downside volatility during corrections [10].
What to Do Now
In an environment where the Fed is deeply divided, inflation is sticky, and central banks are quietly restructuring reserves, gold's century-long track record offers both historical validation and practical protection. Investors should approach gold not as a speculative bet, but as a disciplined allocation for diversification and purchasing power protection. The current volatility, while unsettling, may present opportunities to add exposure at levels that still offer favorable risk-reward profiles relative to the long-term structural case.
The Knowns and the Unknowns
What We Know:
- Gold has delivered positive real returns against inflation over the past century, outperforming cash and bonds [1, 2].
- Current macro conditions are stagflationary: Q2 2026 GDP growth slowed to 1.5%, the PCE deflator registered 6.3%, July CPI came in at 3.4% annual/0.1% monthly, and a divided Fed held rates unchanged with three dissents favoring hikes [1, 3, 4, 7, 23].
- Central banks added ~1,200 tonnes in 2025 and 244 tonnes in Q1 2026, reflecting a structural de-dollarization and long-term confidence in gold [7, 10].
- The USD remains strong in real terms, but fiat purchasing power continues to erode over time [6, 9].
- Gold's long-term role as a safe-haven and inflation hedge is empirically supported, though annual performance is volatile [3].
- August 2026 price action shows strong upward momentum (+8.24% monthly), with trading ranges between $4,043 and $4,434, indicating sustained institutional and retail demand [6].
- Forward models project potential upside toward $4,900 if structural demand and stagflationary dynamics persist [4].
What We Do Not Know:
- The duration and severity of the Middle East energy shock and its secondary impact on global supply chains.
- The Fed's exact rate trajectory and whether real yields will remain elevated enough to pressure gold short-term.
- Whether tariff policies will trigger prolonged stagflationary dynamics that could amplify gold's safe-haven appeal.
- How AI-driven industrial demand, potential monetary regime shifts, and further central bank buying may alter gold's structural demand profile.
- The timing and magnitude of potential USD reserve diversification beyond central banks (sovereign wealth funds, pension systems).
- Whether August's 8%+ monthly surge will consolidate into a base or trigger a profit-taking correction toward $4,000 support.
Conclusion: Gold as the Anchor of a Resilient Portfolio
Gold has undeniably served as one of humanity's most reliable stores of value over the last century, consistently outperforming inflation and preserving purchasing power in a USD-dominated financial system. While it does not replace equities for long-term growth, its historical record, combined with current stagflationary pressures, sticky inflation, and aggressive central bank accumulation, makes it a critical component of a resilient portfolio.
As of mid-August 2026, gold's near-$4,377 price and strong monthly momentum validate its role as a strategic inflation hedge. The Fed's "nail-biter" meeting, the 6.3% PCE deflator, and the 1,200-tonne central bank buying cycle in 2025 all point to an environment where paper assets face headwinds and hard assets are rewarded. Investors should approach gold not as a speculative bet, but as a disciplined allocation for diversification and purchasing power protection. In an environment where short-term expectations are spiked, the Fed is deeply divided, and sovereign buyers are quietly restructuring reserves, gold's century-long track record offers both historical validation and practical protection. The question is not whether gold is a good store of value—it has proven itself over 100 years—but whether investors have the discipline to hold it through the volatility that accompanies its ascent.
Sources
[1] https://alphio.ai/blog/gold-price-prediction-august-2026
[2] https://goldture.com/tools/gold-vs-other-assets-comparison/
[3] https://awealthofcommonsense.com/2026/01/historical-returns-for-stocks-bonds-cash-housing-gold-2025/
[4] https://alphio.ai/blog/gold-price-forecast-august-2026-analysis
[5] https://www.analyticsinsight.net/trading/gold-price-outlook-2026-drivers-volatility-and-cfd-trading-dynamics
[6] https://www.bea.gov/data/personal-consumption-expenditures-price-index-excluding-food-and-energy
[7] https://www.gold.org/goldhub/research/gold-demand-trends/gold-demand-trends-full-year-2025/central-banks
[8] https://onlinegold.org/analysis/central-bank-gold-reserves-2026/
[9] https://www.mantramint.com/blog/central-banks-gold-buying-2025-2026-analysis
[10] https://www.gold.org/goldhub/research/gold-demand-trends/gold-demand-trends-q1-2026/central-banks
[11] https://www.federalreserve.gov/monetarypolicy/2026-07-mpr-part1.htm
[12] https://www.federalreserve.gov/monetarypolicy/2026-07-mpr-summary.htm
[13] https://www.federalreserve.gov/monetarypolicy/2026-07-mpr-part3.htm
[14] https://www.federalreserve.gov/monetarypolicy/2026-07-mpr