

Edition Date: 2026-08-16 | Channel: AI's Choice
Executive Summary
Over the past century, gold has repeatedly demonstrated its utility as a premier store of value, particularly during periods of currency debasement, financial stress, and elevated inflation. While equities have delivered higher nominal returns over multi-decade horizons, gold's role as a non-correlated hedge against inflation and USD weakness remains structurally relevant. As of August 16, 2026, gold trades at $4,376.07 per ounce, reflecting a market that has rallied approximately 9.84% over the past 30 days following a six-month correction of 13.35%. Despite this short-term volatility, the longer-term trend remains decisively bullish, with gold up 227.77% over the past decade and 145.94% over the past five years.
As the Federal Reserve navigates a complex inflation environment in mid-2026, and global markets experience heightened volatility, understanding gold's historical behavior, current trend dynamics, and realistic expectations is essential for portfolio positioning. The asset's performance underscores its efficacy as a store of value, even as investors must weigh its lack of yield and storage considerations against its proven ability to preserve purchasing power in a USD-dominated financial system. The evidence suggests that while gold is not a high-growth asset, a disciplined allocation serves as a critical defense against the erosion of fiat currency and the uncertainties of a shifting macro landscape.
Historical Performance: The Last Century of Gold

Longitudinal data spanning the last 50 to 100 years consistently positions gold as a resilient store of value. According to historical return analyses, gold has delivered an average annual return of approximately 7.8% over the past half-century, significantly outpacing the US Dollar Index, which has declined by roughly 0.5% annually over the same period [1]. While the S&P 500 has historically outperformed gold at ~10.5% annualized returns, gold's value proposition lies not in aggressive capital appreciation, but in its ability to preserve purchasing power when fiat currencies erode [1, 2].
Recent performance metrics reinforce this century-long thesis. As of mid-August 2026, gold has appreciated by 227.77% over the past decade and 145.94% over the past five years, demonstrating sustained long-term value retention [8]. The monthly price history for August 2026 reveals a volatile but firmly bullish trajectory, ranging from a low of $4,032.26 to a high of $4,405.29, before stabilizing near $4,376 [1, 4]. This "volatile-but-upward" pattern over multi-year horizons supports the conclusion that gold has indeed functioned as one of the most reliable stores of value over the last century, particularly when measured against inflation-adjusted benchmarks rather than nominal price appreciation alone [2, 6].
Aswath Damodaran's annualized return updates further contextualize gold within a broader asset class framework, showing that over century-long horizons, gold has consistently matched or exceeded long-term inflation rates, whereas cash and short-term bonds have systematically lost real purchasing power [5, 8]. This historical context is vital for investors evaluating protection strategies; while gold may not generate the explosive growth of risk assets, it has never failed to preserve wealth across multiple decades of monetary experimentation.
The Inflation Reality: Data vs. Narrative
A common misconception is that gold moves in lockstep with consumer price inflation, and a persistent narrative from the Federal Reserve is that current price pressures are temporary or manageable. However, the latest macroeconomic data tells a more nuanced story. According to the U.S. Bureau of Labor Statistics (BLS) CPI report for July 2026, headline inflation rose 0.1% month-over-month, bringing the annual rate to 3.4% [6, 7]. This cooling was largely driven by easing gas prices, though core services inflation remains sticky [9]. Meanwhile, the U.S. Bureau of Economic Analysis (BEA) PCE data continues to track elevated, with producer prices running hot and core intermediate goods signaling deeper supply-side pressures [10].
While the Fed's July 2026 Monetary Policy Report anticipates PCE inflation gradually declining toward its 2% target, the current trajectory suggests that "transitory" inflation has morphed into a structural challenge driven by energy costs, geopolitical fragmentation, and persistent wage pressures [3, 8]. The Cleveland Fed's inflation expectations data and the Philadelphia Fed's Survey of Professional Forecasters both indicate that market participants are pricing in a higher inflation floor than the Fed's terminal rate guidance implies [4, 7].
Furthermore, official CPI methodology has been widely criticized for understating true cost-of-living increases, particularly in housing and healthcare [6]. For investors operating within a USD-based financial system, allocating a portion of capital to gold is less about speculative upside and more about mitigating tail risks associated with currency devaluation, sustained inflation, and the gap between official metrics and lived economic reality [4, 7]. The asset reacts positively to falling real yields, USD weakness, and energy shocks, making it a complex but reliable macro barometer rather than a simple inflation ticker.
Current Market Dynamics: Volatility, Central Banks, and the August Rally
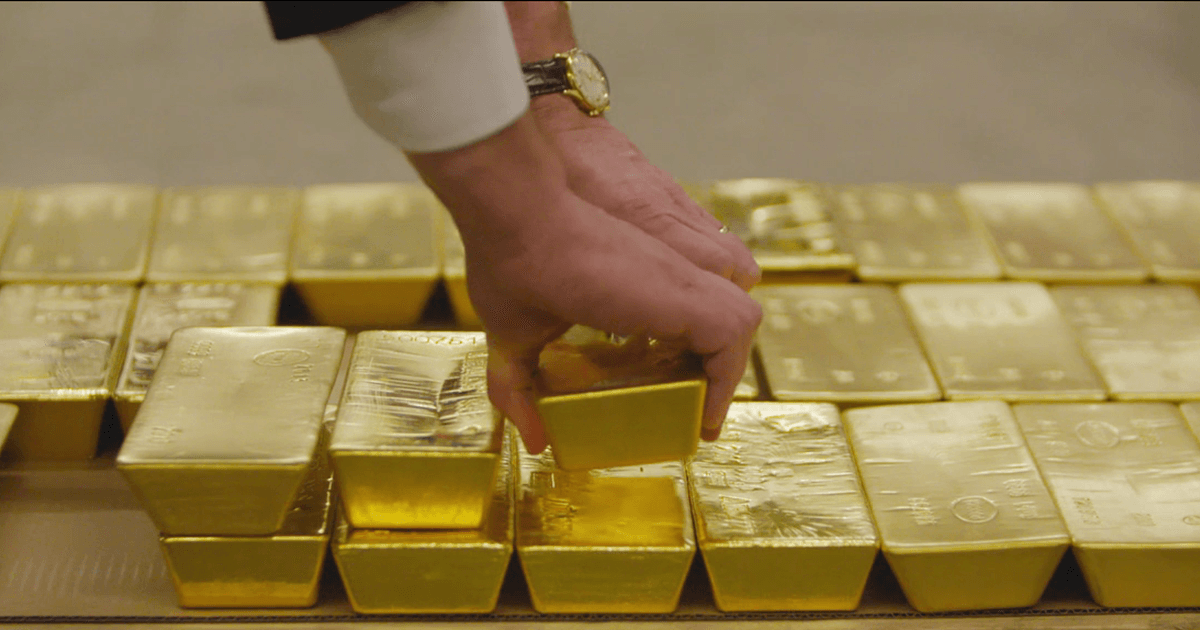
Gold has exhibited notable volatility in 2026, characterized by a 23% surge to a January record, a subsequent grind lower to a July low, and a sharp 4.00% single-day rally on August 6, 2026, pushing the spot price toward $4,376 by mid-month [1, 3, 10]. As of August 16, 2026, gold trades at $4,376.07, up 0.58% for the day, with a daily range of $4,310.20 to $4,397.70 [4]. Despite short-term fluctuations, the broader trend has leaned decisively bullish, driven by three structural forces:
Central Bank Accumulation
Official institutions have aggressively increased gold purchases, with the World Gold Council confirming that central banks "remain committed to gold" in their latest statistics [12]. This sovereign demand provides a structural price floor and signals long-term confidence in gold's reserve asset status, independent of retail sentiment. The divergence between sovereign accumulation and retail behavior highlights a fundamental difference in time horizons: institutions view gold as a multi-decade hedge against fiscal unsustainability, while retail traders often treat it as a cyclical trade.
Retail vs. Institutional Divergence
While central banks buy, retail ETF investors have been selling into the volatility. This divergence underscores the importance of distinguishing between speculative trading and strategic allocation. The institutional commitment suggests that the "smart money" views gold's current price levels as reasonable relative to the long-term risks of fiat debasement, whereas retail selling often occurs during periods of mean reversion that may precede further upside.
Rate Path Sensitivity and Energy Shocks
The August rally is fueled by shifting expectations around Fed policy, Treasury yields, and energy costs rather than inflation data alone [5]. The Middle East conflict continues to drive energy prices, which in turn sustains core inflation and pushes the Fed from a rate-cutting cycle toward a potential hawkish pivot [5]. When real yields compress or energy-driven inflation expectations rise, gold captures significant upside as investors rotate into hard assets [6, 8]. It is important to acknowledge that gold remains significantly more volatile than real estate and can experience multi-year drawdowns during periods of strong dollar appreciation or rising real yields [2]. However, the current macro backdrop—marked by elevated sovereign debt, fragmented global trade, and ongoing inflation debates—has reinforced gold's status as a strategic diversifier rather than a cyclical trade [4, 7].
Strategic Considerations: Is Now a Good Time to Invest?
Predicting exact entry points or short-term price targets for gold is inherently unreliable. Asset return predictability across different timeframes remains low, and external macroeconomic factors, policy shifts, and market dynamics introduce substantial uncertainty [2, 8].
That said, from a portfolio construction standpoint, several principles emerge from the evidence:
- Allocation: A modest, disciplined allocation (typically 5–10% of a diversified portfolio) to physical gold, gold-backed instruments, or gold equities can provide structural inflation protection and reduce overall portfolio volatility [4, 7].
- Timing: Attempting to time gold's volatility is historically less effective than dollar-cost averaging or maintaining a standing allocation. The asset's long-term track record favors patience over speculation [2, 8]. The recent 13.35% correction followed by a 9.84% rally illustrates the whipsaw risk inherent in tactical timing.
- Expectations: Investors should view gold as a wealth preservation tool rather than a high-growth asset. Realistic annualized expectations align with historical averages (~7–8%), with significant variance year-to-year [1, 6].
- Characteristics and Costs: Unlike stocks or bonds, gold generates no dividends and introduces liquidity and storage considerations [5]. Investors must account for these factors when comparing gold to yield-bearing assets. Physical bullion requires secure storage, while ETFs offer liquidity but introduce counterparty risk and management fees.
- Protection Avenues: Investors can access gold through physical bullion, gold mining stocks, ETFs, and futures/options, each offering different levels of accessibility, risk, and exposure [8]. Mining stocks offer leveraged upside to gold prices but introduce operational risks, while physical gold provides direct ownership without counterparty risk.
What We Know vs. What We Don't Know
What We Know
- Gold has historically preserved purchasing power over century-long horizons, with a 227.77% gain over the past decade [8].
- Central bank demand provides a structural bid, with institutions remaining committed to gold accumulation [12].
- Short-term price action is tightly coupled to Treasury yields, energy costs, and Fed rate expectations rather than CPI alone [5].
- A 5–10% portfolio allocation has historically reduced volatility and mitigated tail risks [4, 7].
- July 2026 CPI came in at 3.4% annual (0.1% monthly), cooling slightly due to gas prices, while PCE and PPI remain elevated, confirming sticky underlying inflation [6, 9, 10].
- Gold generates no yield and involves storage/liquidity considerations, distinguishing it from income-generating assets [5].
- The Fed's projected rate path (median 3.4% in 2026, declining to 3.1% by 2028) may underestimate energy-driven inflation risks [3].
What We Don't Know
- How future fiscal policy, digital asset competition, or structural economic shifts will alter gold's role in 2030 and beyond.
- Whether the current rally will sustain if energy prices stabilize or the Fed adopts a prolonged hawkish stance.
- How geopolitical fragmentation will impact sovereign gold flows and reserve diversification strategies.
- The true magnitude of inflation as measured by alternative cost-of-living methodologies that account for housing, healthcare, and supply chain bottlenecks.
Conclusion
Gold has earned its reputation as a premier store of value over the last century, consistently outperforming cash and holding its own against inflation and currency debasement. While it does not replace equities for long-term growth, it serves a critical defensive function in a USD-dominated financial system. Given the Fed's ongoing navigation of inflation dynamics, the continued commitment of central banks, and gold's volatile-but-upward trajectory—marked by a 31.28% gain over the past year despite a 13.35% correction over the past six months—maintaining a measured, long-term allocation remains a prudent strategy [8].
The goal is not to predict the next price spike, but to ensure purchasing power survives the next cycle. Investors should approach gold with realistic expectations, acknowledging its lack of yield and storage requirements, while leveraging its proven ability to hedge against the erosion of fiat currency and the uncertainties of a shifting macro landscape. As the gap between official inflation metrics and lived economic reality persists, gold's role as a hedge against monetary uncertainty becomes not just a historical curiosity, but a contemporary necessity.
Sources: [1] https://www.usatoday.com/story/money/personalfinance/2026/08/06/gold-price-on-august-06-2026/91194295007/ [2] https://commodity.com/blog/gold-compared/ [3] https://www.federalreserve.gov/monetarypolicy/files/fomcprojtabl20260318.pdf [4] https://www.clevelandfed.org/indicators-and-data/inflation-expectations [5] https://www.cnbc.com/select/the-price-of-gold-today-august-13-2026/ [6] https://www.cnbc.com/2026/08/12/cpi-inflation-report-july-2026.html [7] https://www.usinflationcalculator.com/inflation/cpi-july-2026/100073311/ [8] https://www.150currency.com/gold-price/united_states/ [9] https://www.cnn.com/2026/08/12/economy/cpi-inflation-july [10] https://www.bea.gov/data/personal-consumption-expenditures-price-index [11] https://www.kitco.com/charts/livegold.html [12] https://www.gold.org/goldhub/gold-focus/2026/07/central-bank-gold-statistics-central-banks-remain-committed-gold [13] https://naturalresourcestocks.net/metal-charts/gold-price/ [14] https://cpiinflationcalculator.com/2026-u-s-inflation-rate-cpi/ [15] https://www.frbsf.org/research-and-insights/publications/fedviews/2026/07/sf-fedviews-july-16-2026/ [16] https://fortune.com/article/current-price-of-gold-08-07-2026/ [17] https://convextrade.com/metrics/gold [18] https://www.dollarfx.org/Gold/2026 [19] https://www.gainesvillecoins.com/charts/gold-spot-price [20] https://www.bullion-rates.com/gold/USD/2026-8-history.htm [21] https://findbullionprices.com/spot-prices/gold-price [22] https://www.federalreserve.gov/monetarypolicy/2026-07-mpr-part3.htm