

Research Report: Gold as a Store of Value, Inflation Hedge, and Current Market Dynamics
Edition Date: 2026-08-11
Topic: Analysis of gold's historical performance, role in a USD-centric economy, inflation protection, central bank dynamics, and current market trends.
Executive Summary
Gold has solidified its position as a premier store of value, outperforming the US Dollar, cash, bonds, and real estate over multi-decade horizons while delivering consistent real returns above inflation. As of August 11, 2026, gold is trading at approximately $4,378.65 per ounce, reflecting a notable correction from the $5,000 support level observed earlier in the year. Despite a 13.85% decline over the past six months, gold has delivered substantial long-term appreciation, rising 27.28% over one year, 150.66% over five years, and 221.23% over a decade.
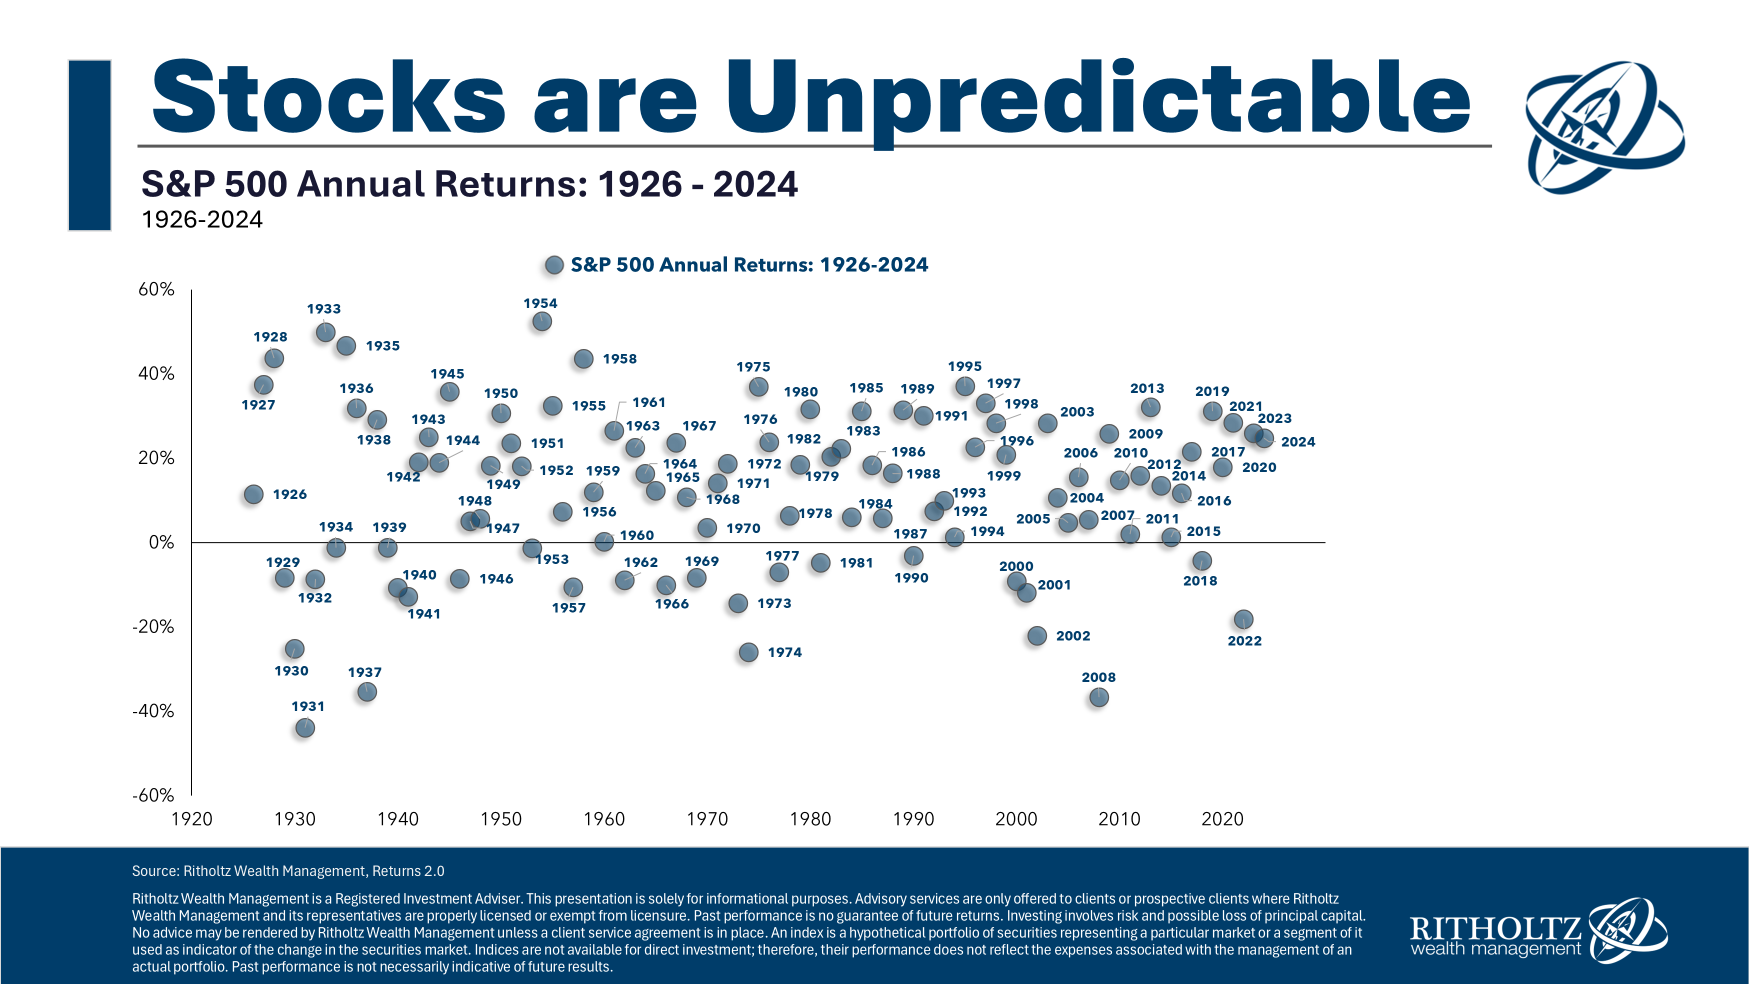
The market has exhibited high volatility with an upward bias, driven by sustained central bank demand and a structural hedge against USD depreciation. While the Federal Reserve's official projections indicate managed inflation expectations, current macroeconomic data reveals a more persistent reality. As of mid-July 2026, headline inflation remains at 4.1% and core inflation at 3.9%, significantly exceeding the Fed's 2% target. This divergence between official forecasts and ground-level price pressures reinforces gold's utility as a hedge against monetary debasement and policy missteps. Equities remain superior for wealth accumulation (~10.5% average annual return over 50 years), but gold excels in capital preservation and hedging against currency devaluation in a fiat-based system.
Introduction: Gold at the Crossroads of Volatility and Value
The conversation surrounding gold in August 2026 is no longer a niche debate among precious metals enthusiasts; it is a central macroeconomic question. With the price of gold hovering around $4,378.65 per ounce, the asset has become a focal point for investors navigating a complex landscape of persistent inflation, geopolitical uncertainty, and shifting monetary policy [2]. The narrative that gold is merely a "crisis asset" has been thoroughly dismantled by the data. Instead, gold has emerged as a structural pillar of portfolio defense, offering a counterbalance to the erosive forces of currency devaluation and policy error.
However, the path to the current price level has been anything but linear. The asset recently underwent a sharp correction, shedding 13.85% over a six-month period as it pulled back from the psychological $5,000 support level [2]. This volatility has sparked debate: is the bull run intact, or has gold peaked? The answer lies in distinguishing between short-term price action and long-term value preservation. While the correction highlights the risks of leverage and sentiment shifts, the underlying drivers—central bank accumulation, inflation persistence, and USD depreciation—remain firmly in place. This report synthesizes current evidence to determine whether gold truly stands as the best store of value over the last century, how it protects wealth in a USD-dominated economy, and what the current market dynamics suggest for the months ahead.
The Century-Long Store of Value: Analyzing the Data
To evaluate gold's claim as the "best store of value" over the last century, we must look beyond nominal price spikes and examine real returns relative to purchasing power. The data reveals a compelling story of resilience, though it requires nuance when compared to other asset classes.
Long-Term Returns and Real Performance
Gold has delivered consistent positive real returns, though performance varies significantly by measurement period. Research indicates that from 1928 to 2024, gold delivered an average annual return of +5.12% [3]. Over the last 50 years (approximately 1974–2024), this average annual return rose to +7.8% [1]. This acceleration in performance is not coincidental; it reflects the structural shift from the gold standard to floating fiat exchange rates. The post-1974 era, characterized by unchecked currency expansion, has seen gold act as a powerful hedge against the debasement of paper money.
Crucially, gold has consistently outpaced inflation. Over the long term, inflation has averaged approximately ~3% annually [3]. By delivering returns of +5.12% to +7.8% depending on the period, gold has generated positive real returns, preserving purchasing power where cash and bonds have failed. Over the past decade alone, gold has appreciated by 221.23%, underscoring its effectiveness as a long-term wealth preservation tool [2].
The 1974 Inflection Point
A synthesis of historical data reveals a critical inflection point in 1974, when the US fully abandoned the gold standard. Pre-1974, gold's performance was constrained by its peg to the dollar. Post-1974, as central banks gained the ability to expand money supplies without constraint, gold's nominal performance surged. This suggests that gold's value as a store of value is inversely correlated with the degree of monetary freedom enjoyed by central banks. In an era of "higher-for-longer" rates and persistent inflation, this dynamic is more relevant than ever.
Gold vs. The Asset Class Hierarchy: Growth, Preservation, and the Dollar
While gold preserves wealth, the question of whether it is the "best" store of value depends on the investor's objective: wealth accumulation or wealth preservation. A comparison of asset classes reveals distinct roles.
| Asset Class | Average Annual Return (50-Year) | Role |
|---|---|---|
| S&P 500 | ~10.5% | Growth / Outperformance |
| Gold | ~7.8% | Preservation / Inflation Hedge |
| US Dollar Index | -0.5% | Currency Devaluation |
| Cash / Bonds / Real Estate | Lower than gold | Underperform gold over long horizons |
- Equities: The S&P 500 offers significantly higher average returns (~10.5% over 50 years) but comes with higher volatility and drawdown risk [1]. For investors seeking growth, equities remain superior. However, small-cap equities have also outperformed gold, though with higher risk profiles [3].
- Bonds, Cash, Real Estate: Gold has outperformed these asset classes over the long term, reinforcing its utility as a diversifier and wealth preservation tool [3].
- The Dollar: Over the last 50 years, the US Dollar Index declined by approximately 0.5% in real terms, reflecting sustained loss of purchasing power [1].
Synthesis: Gold is not the highest-performing asset class in terms of total return, but it excels in capital preservation and hedging against monetary debasement. The consensus among sources [1, 3] is that while equities win on raw growth, gold wins on the preservation of real wealth. In a USD-centric economy where the dollar loses purchasing power, gold serves as a critical counterbalance.
The Inflation Reality Check: Fed Projections vs. Ground Truth
One of the most contentious aspects of the current macro environment is the divergence between Federal Reserve projections and ground-level inflation data. The original inquiry raised the claim that the Fed views inflation as "not a big deal." Official projections and recent data provide a more nuanced picture.
Current Inflation Reality
As of mid-July 2026, U.S. inflation remains persistently elevated. Headline inflation stands at 4.1% and core inflation at 3.9%, significantly exceeding the Fed's 2% target [9]. Energy volatility and core price pressures continue to drive the trend, suggesting that inflation is stickier than many policymakers anticipated.
Fed Stance and Projections
The Federal Reserve has held rates steady at 3.50–3.75%, adopting a "higher-for-longer" stance that acknowledges inflation remains elevated [8]. The FOMC projects PCE inflation at 3.60% for 2026, declining to 2.35% in 2027 and 2.05% in 2028 [4]. This outlines an official trajectory where inflation gradually returns to target.
The Divergence
Here lies the critical disagreement: the Fed projects 3.60% PCE for 2026 [4], but current ground-level data shows 4.1% headline inflation [9]. This disconnect indicates that investors are pricing in risks beyond the Fed's current guidance. Historical evidence suggests gold hedges against scenarios where inflation persists longer than forecasts, or where monetary policy prioritizes other objectives over price stability. The 13.85% six-month correction from $5,000 to ~$4,378 reflects short-term volatility, but the underlying trend remains supported by persistent inflation and currency devaluation fears [2, 7].
Analysis: Gold's value often emerges during periods where policy outcomes diverge from expectations. If the Fed's projections prove optimistic and inflation remains sticky, gold is likely to re-rate higher. The disconnect between official forecasts and reality reinforces gold's utility as a hedge against policy missteps.
The USD Anchor: Wealth Protection in a Dollar-Centric Economy
The global financial system is built on the US Dollar. While this confers significant advantages, it also exposes holders of USD-denominated assets to the risk of currency devaluation. Gold retains its status as a global reserve asset, providing a hedge against USD-centric financial system risks [7].
Structural Role of Gold
Gold's performance is inversely correlated with the purchasing power of the US Dollar. As the dollar loses purchasing power, gold prices tend to rise in nominal terms, preserving real wealth [1]. This structural relationship makes gold an essential component of any portfolio exposed to a fiat-based system. In an economy built on the USD, gold serves as a critical counterbalance to currency devaluation.
Central Bank Demand: The Structural Driver
Central banks have emerged as the primary tailwind for gold prices, fundamentally altering the demand landscape:
- Q1 2026 Trends: World Gold Council data indicates continued robust central bank purchasing in Q1 2026 [9].
- Tactical vs. Strategic: Recent reported sales by some central banks were identified as tactical liquidity maneuvers rather than a strategic retreat from gold, signaling that underlying demand remains resilient [2].
- Geoeconomic Signals: Central bank buying signals a long-term shift toward de-dollarization and reserve diversification, reinforcing gold's role as a neutral store of value amid rising geoeconomic uncertainty [7].
Synthesis: Sources [7, 9] agree that central bank demand is a structural, long-term trend unlikely to reverse quickly. While tactical sales may occur, the strategic accumulation pattern supports gold's price floor. This demand reflects a broader shift in the global monetary order, where gold is increasingly viewed as a hedge against USD dominance.
Current Market Dynamics: The $5,000 Correction and Central Bank Tailwinds
The current market landscape is defined by high volatility with an upward bias. Understanding the recent price action is essential for investors assessing entry points and risk.
Price Action and Volatility
- Current Price: Gold is trading at approximately $4,378.65/oz as of August 11, 2026 [2].
- Short-Term Volatility: The asset has experienced significant near-term swings, with a weekly gain of 7.36% and a monthly increase of 5.20%, contrasting with a 13.85% decline over the past six months [2]. The daily trading range of $4,372.10 to $4,435.90 highlights ongoing intraday volatility [7].
- Correction from $5,000: While gold held firm near $5,000 in early 2026, the subsequent six-month pullback demonstrates that the long-term bull run is punctuated by sharp, leveraged corrections [2, 9].
- Long-Term Trajectory: Despite recent volatility, the multi-year trend remains strongly positive, with 10-year returns exceeding 221% [2].
Access and Liquidity Considerations
Gold functions as a non-yielding asset that does not generate dividends or interest, meaning returns depend entirely on price appreciation [3]. Investors seeking exposure have three primary access methods, each with distinct trade-offs:
- Physical Bullion/Coins: Offers direct ownership and privacy but incurs storage, insurance, and liquidity costs.
- Gold ETFs: Provide high liquidity and ease of trading but involve management fees and counterparty risk.
- Gold IRAs: Allow for tax-advantaged holding of physical gold but require approved custodians and higher minimum investments [3].
Analysis: The 7.36% weekly gain and 5.20% monthly increase suggest that the correction may be stabilizing, with buyers stepping in at lower levels. However, the 13.85% six-month decline serves as a reminder that gold is not immune to drawdowns. Investors should expect volatility and avoid extrapolating past performance as a guarantee of future results.
What We Know, What We Expect, and What Remains Unknown
Synthesizing the evidence allows us to categorize our understanding of gold's future into knowns, expectations, and uncertainties.
What We Know
- Central Bank Dominance: Central bank demand is a structural, long-term trend unlikely to reverse quickly. Tactical sales do not negate the strategic accumulation pattern [2].
- Inflation Persistence: Current data shows inflation remains elevated (4.1% headline, 3.9% core), challenging official projections and reinforcing gold's hedge utility [9].
- USD Devaluation: The long-term trend of USD depreciation in real terms supports gold's nominal appreciation [1].
- Volatility: Gold exhibits significant short-term volatility, with a 13.85% decline over six months and 7.36% weekly swings, amplified by leverage and CFD trading dynamics [6, 9].
- Rate Environment: The "higher-for-longer" interest rate environment, driven by energy prices and sticky core inflation, creates a complex backdrop where non-yielding assets like gold compete with bonds for capital [8].
What We Expect
- Continued Upside Bias: Supported by central bank buying and persistent inflation data, the structural trend favors higher prices, though corrections are possible [1, 8].
- Policy Divergence: Gold may outperform if inflation proves stickier than the Fed projects or if geopolitical risks escalate [7].
- Diversification Value: Gold remains a critical portfolio diversifier, offering uncorrelated returns to equities and bonds over the long term [3].
What We Do Not Know
- Short-Term Trajectory: Predicting exact price movements or timing corrections is unreliable due to market volatility and leverage [6].
- Central Bank Behavior Shift: While current trends are bullish, a sudden shift in central bank policy or a resolution to geoeconomic tensions could reduce demand [2].
- Fed Policy Impact: The exact impact of future rate path adjustments on gold prices remains uncertain, particularly if the Fed signals aggressive tightening [4].
- Decade-by-Decade Shifts: Market leaders and laggards change by decade. There are no constants in asset performance across all periods [3].
Conclusion: The Verdict on Gold as a Store of Value

Gold has been the best store of value when defined as protection against inflation and currency devaluation, outperforming the US Dollar, cash, bonds, and real estate over multi-decade horizons. However, it underperforms equities in terms of raw average returns.
- For Inflation Protection: Gold is a proven hedge, delivering real returns above inflation (~3%) over the long term. Current data showing 4.1% headline inflation further validates its role as a buffer against purchasing power erosion.
- For USD Risk: Gold provides a structural hedge against the depreciation of the US Dollar in a fiat-based financial system.
- For Growth: Equities remain superior, though with higher volatility and risk.
- Outlook: Gold's role as a reserve asset and inflation hedge remains strongly supported by evidence. The ~$4,378 price level and sustained central bank buying in August 2026 reflect a market that is pricing in long-term currency devaluation and geoeconomic uncertainty, even as the Fed projects managed inflation. The 13.85% six-month correction from $5,000 highlights that gold's long-term uptrend is not linear; investors should expect volatility and avoid extrapolating past performance as a guarantee of future results. The disconnect between official Fed projections (3.60% PCE for 2026) and current reality (4.1% headline) suggests that gold's value often emerges during periods where policy outcomes diverge from expectations.
Sources:
[1] https://mintedmetal.com/guides/is-gold-good-investment/
[2] https://www.150currency.com/gold-price/united_states/
[3] https://vieclaire.com/en/blog/equities-bonds-and-gold-a-century-of-performance-compared/
[4] https://www.federalreserve.gov/monetarypolicy/fomcprojtabl20260318.htm
[6] https://www.analyticsinsight.net/trading/gold-price-outlook-2026-drivers-volatility-and-cfd-trading-dynamics
[7] https://www.indexbox.io/blog/central-bank-policy-and-inflation-shape-2026-gold-market-dynamics/
[8] https://www.policyrix.com/news/2026-06-26/federal-reserve-higher-for-longer-rates-june-2026-inflation
[9] https://www.frbsf.org/research-and-insights/publications/fedviews/2026/07/sf-fedviews-july-16-2026/
[10] https://fred.stlouisfed.org/series/PCECTPICTM
[11] https://www.cnbc.com/select/the-price-of-gold-today-august-6-2026/